10:00
Introduction to Education Finance Equity & R
2023-06-06
Meet your instructors

Alex Spurrier, Associate Partner

Jennifer Schiess, Senior Partner & Policy and Evaluation Practice Leader

Krista Kaput, Senior Analyst

Bonnie O’Keefe, Senior Associate Partner
Your cohort is part of a growing network of education finance advocates
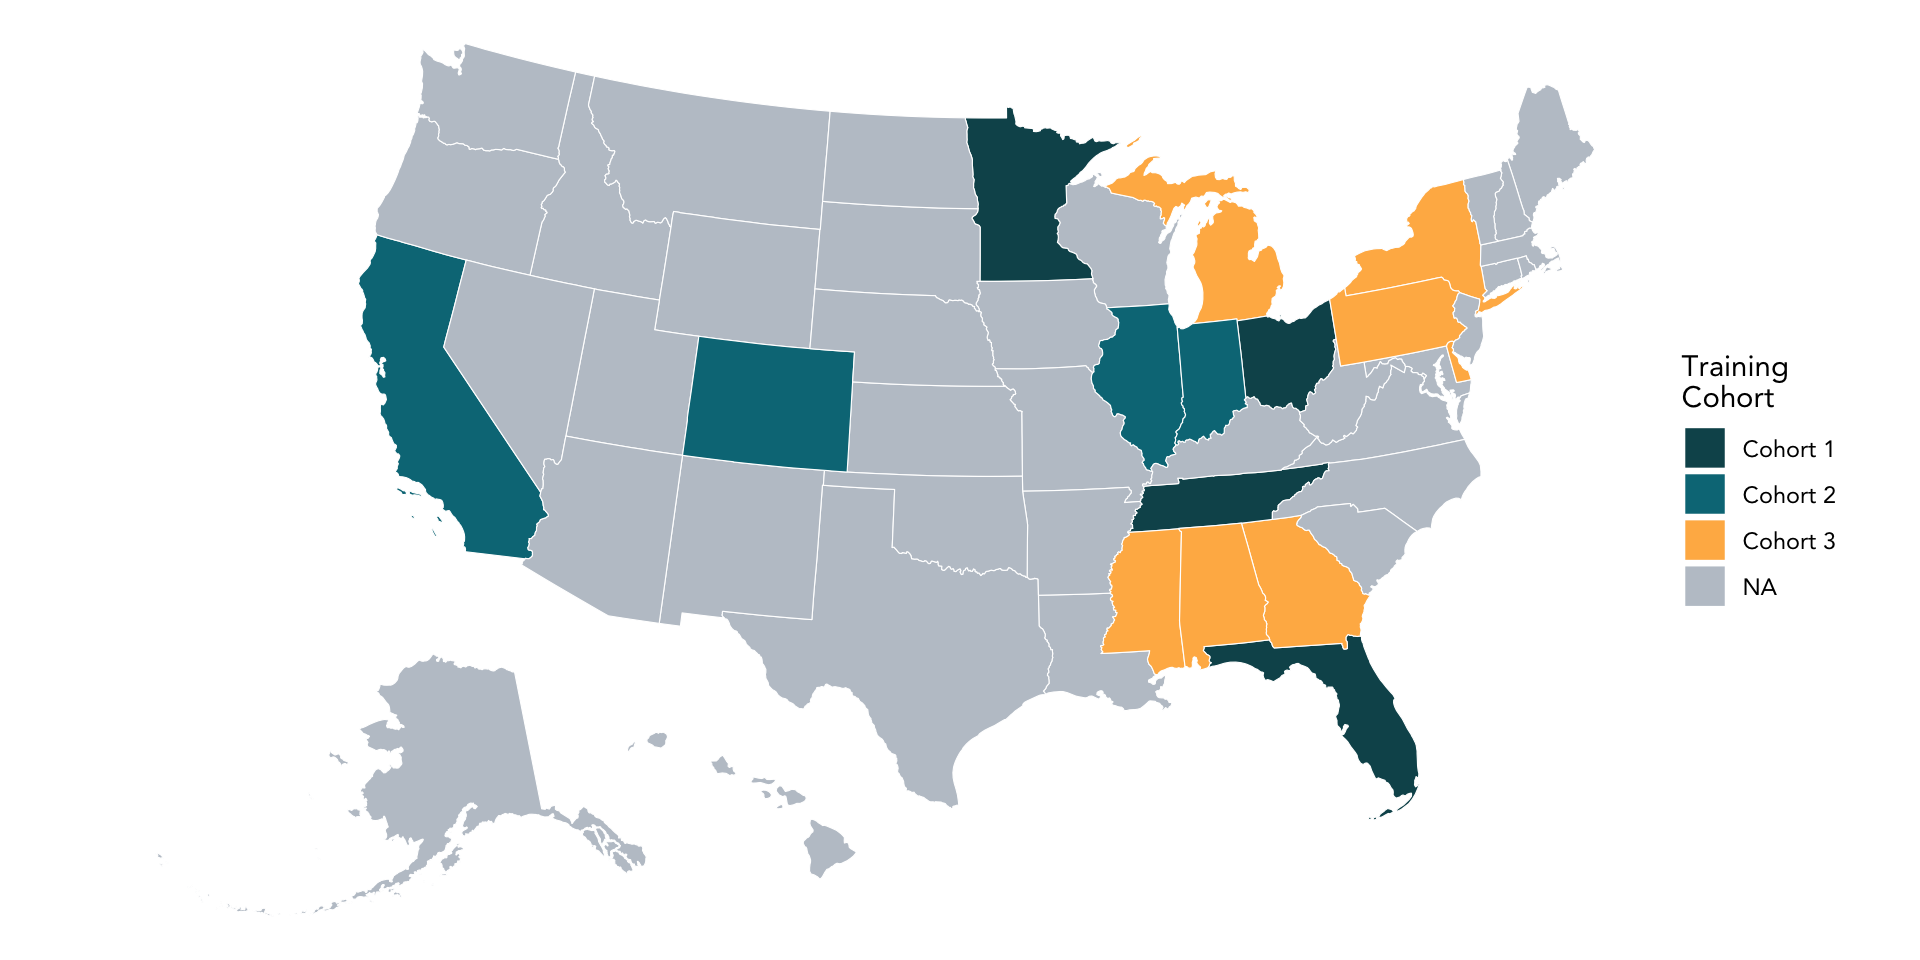
Getting to know Cohort 3

Please share your:
- Name
- State
- Organization
- Role
- Any prior experience with R?
- Why did you take this course?
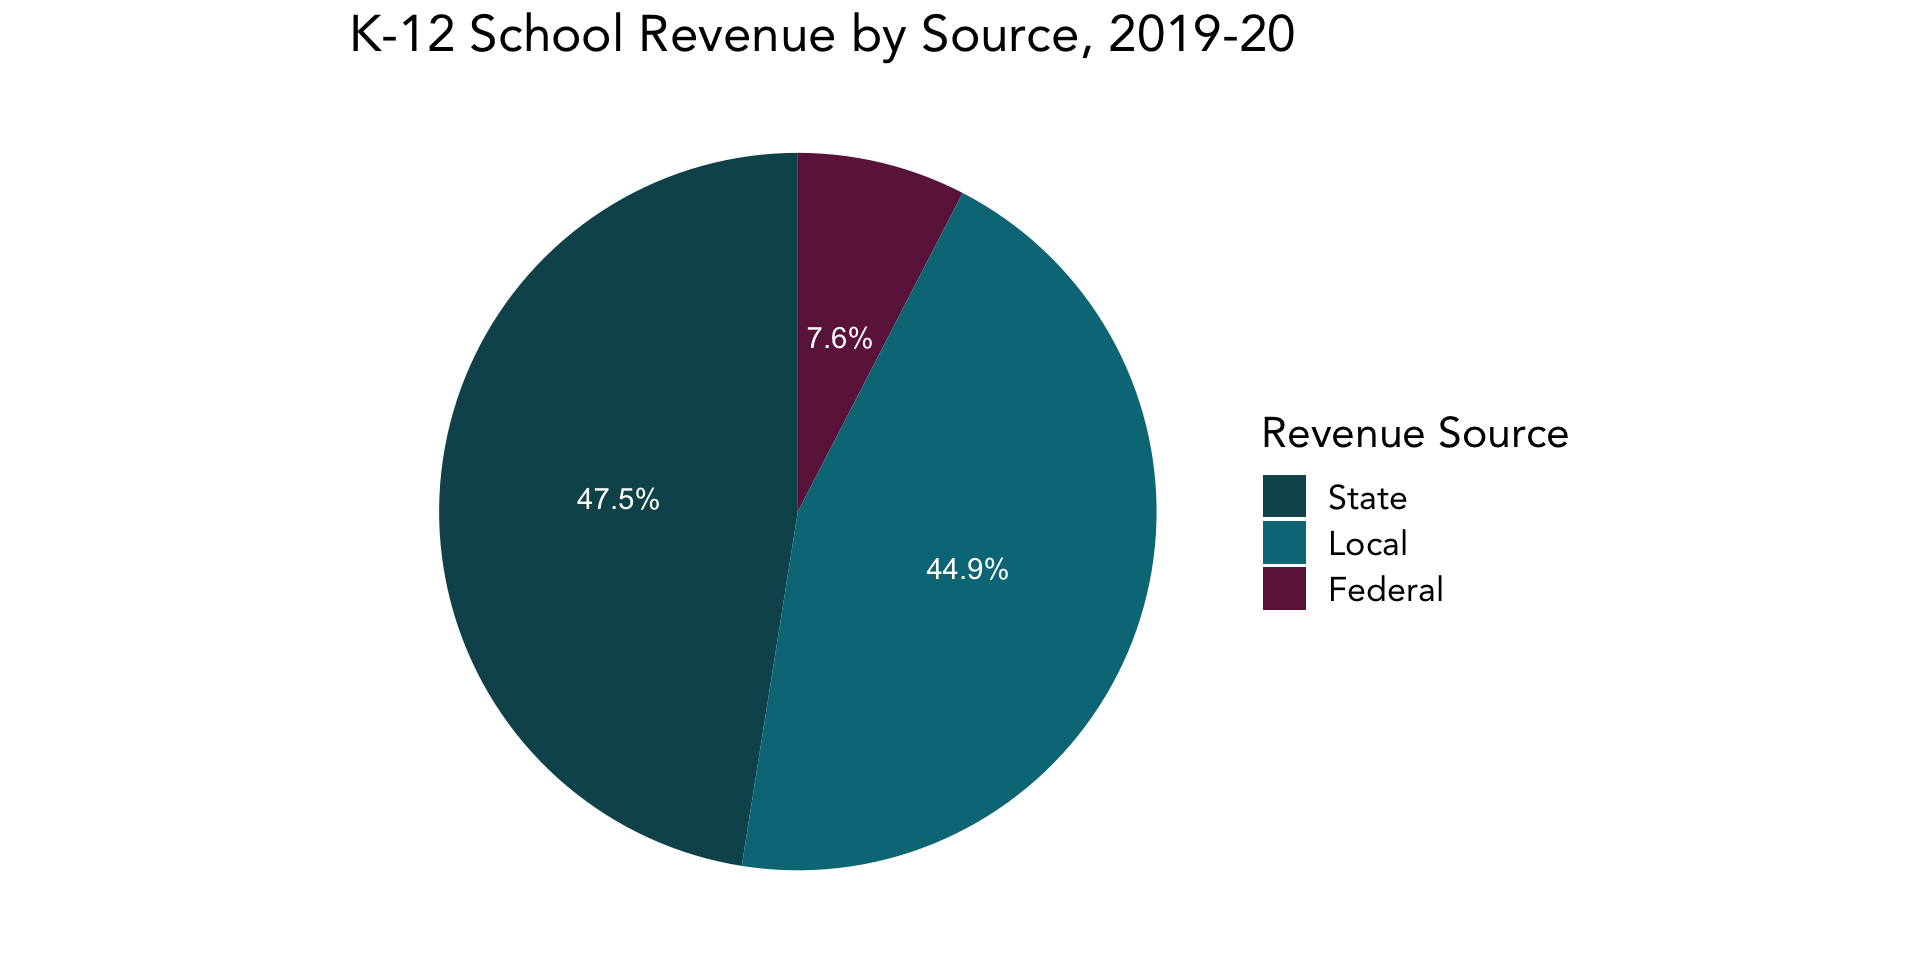
Follow the money: where does it all come from?
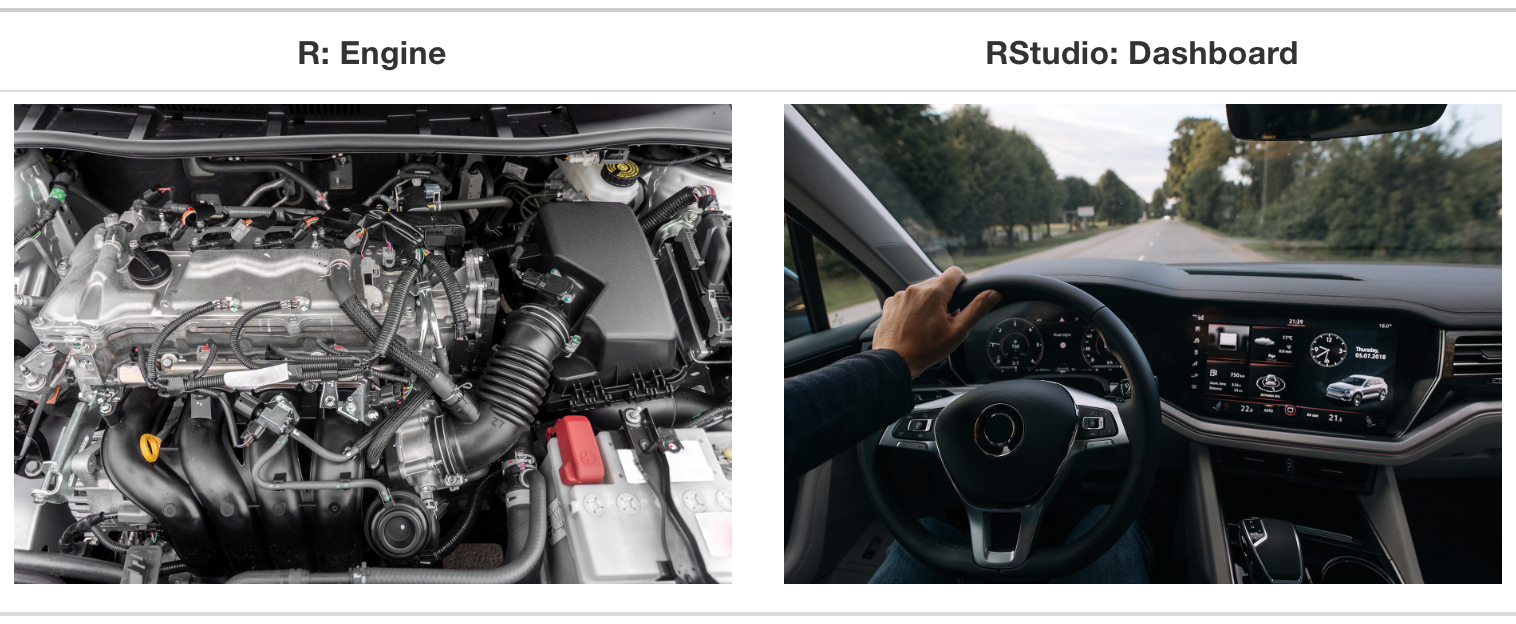
What are R and RStudio and how do they work together?
R is a statistical programming language. RStudio is a graphical user interface (GUI) that allows R users to better organize and execute R code.
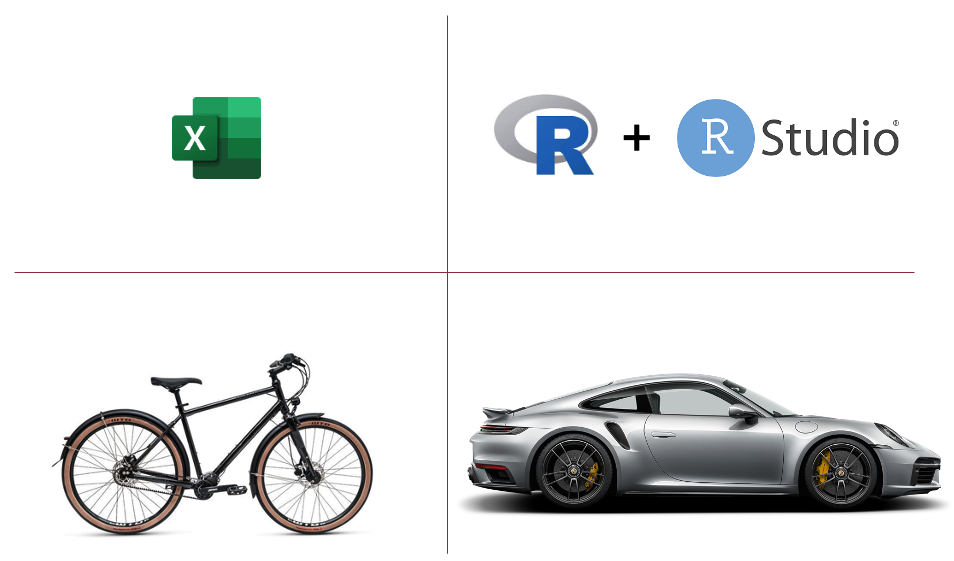
Compared to other data analysis tools, R and RStudio are more powerful and precise – it’s a blessing and a curse
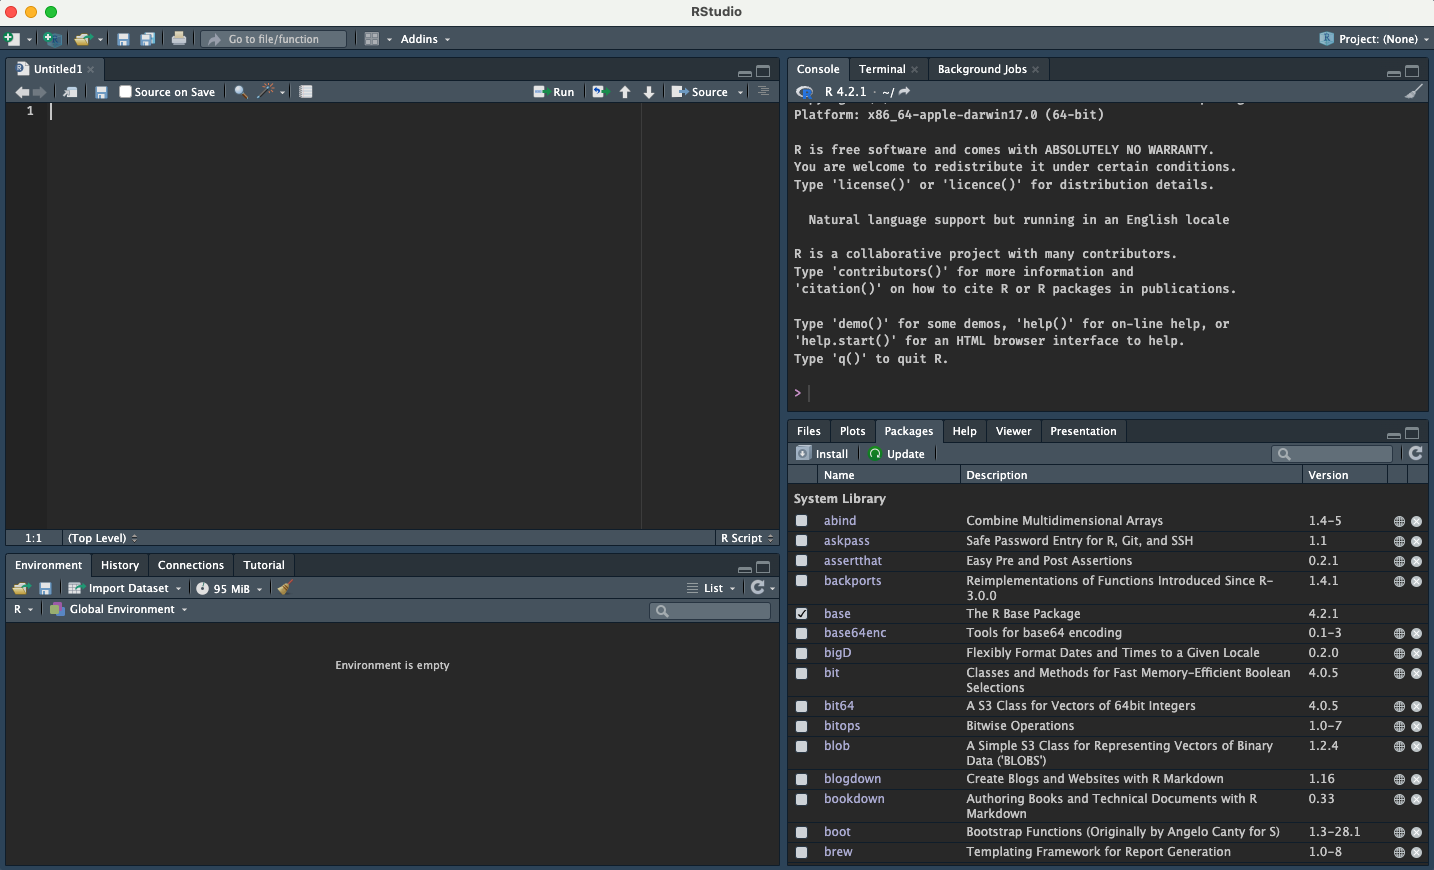
RStudio’s interface is divided into quadrants that allow users to edit and run code, view plots, and read help docs
Packages are collections of R functions – they allow users to easily extend what they can do in R
Packages are an important part of expanding what users can do in R, minimizing barriers to high-quality data analysis and visualization.
The most popular packages are available directly through RStudio via the CRAN network.
CRAN packages are reviewed by the R community for quality
Can be installed via the RStudio GUI or through the R console via the install.packages() function
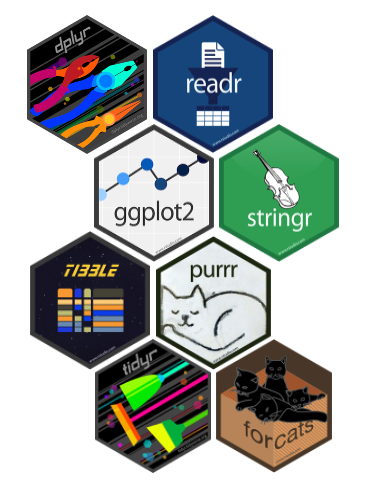
The most popular packages in the R community are part of what is called the “tidyverse”
ggplot2,tidyr,dplyr,stringr,forcats,tibble,readr,purrrTidyverse packages are built to work together
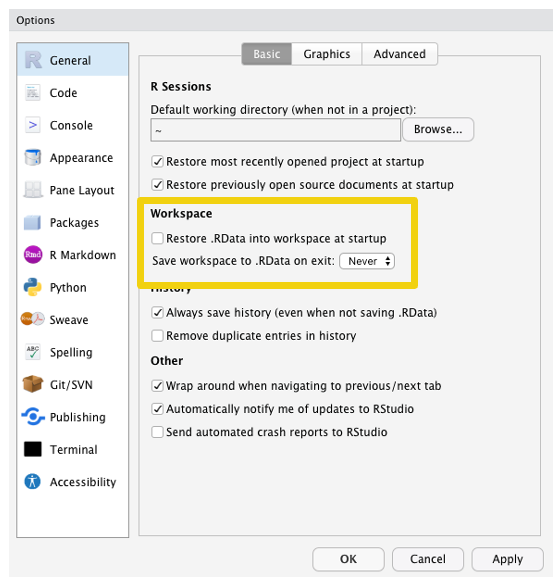
Adjusting your RStudio defaults
- When working in RStudio, you want to be sure you control and understand everything in your working environment
- By default, R will save the variables and history of what you’re working on as you quit and bring in back when you restart
- This creates bad data management habits – you want to start each coding session fresh, building up your variables by running your code
- Don’t rely on remembering what past you was trying to do!
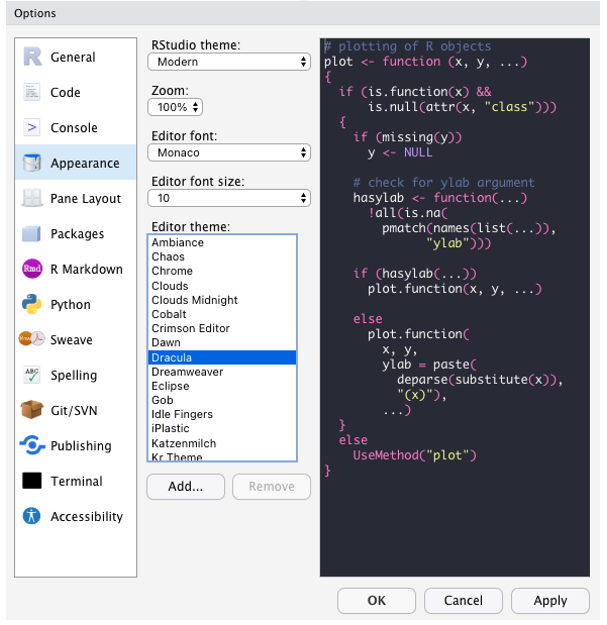
RStudio lets you arrange your interface in different ways; we should share a common approach
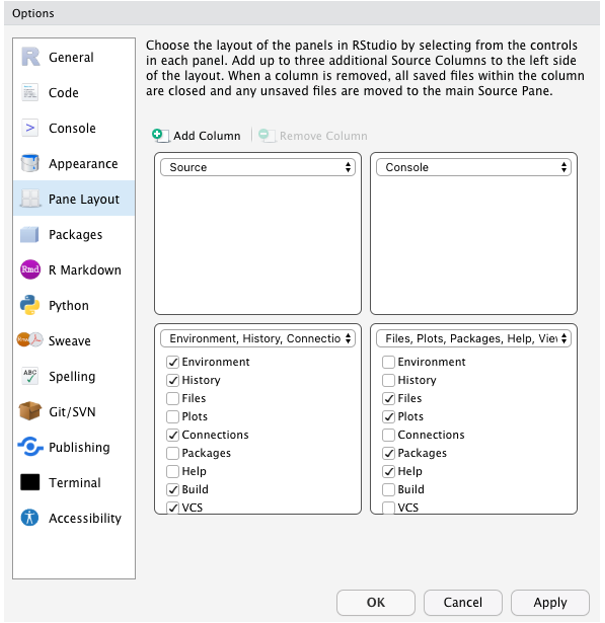
You’ll spend a lot of time working in RStudio – you should make it look like something that you’ll enjoy seeing
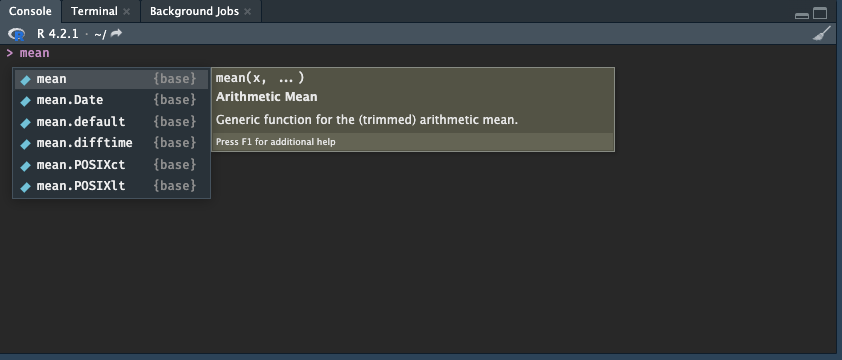
Use Tab to auto-complete a variable or function as you are typing it, or the up/down arrows to cycle through options
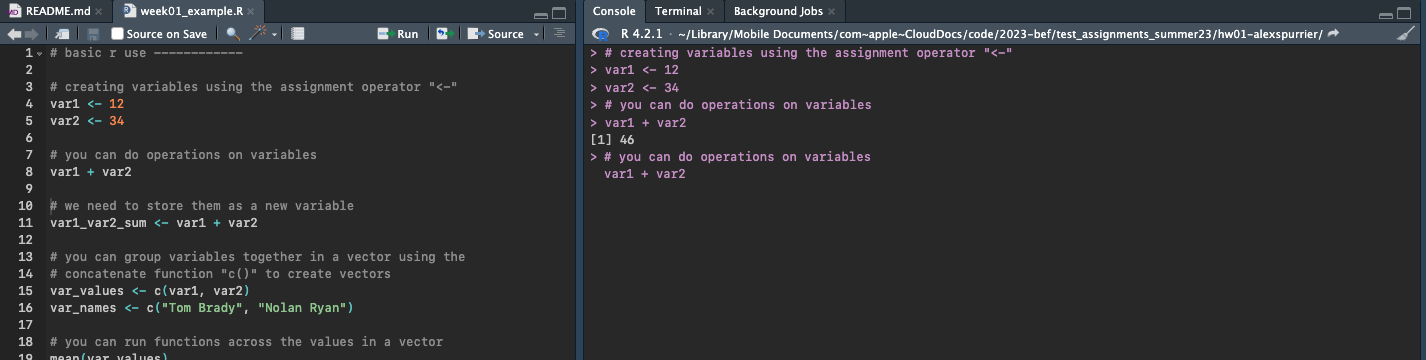
Use CMD/CTRL + ENTER to run a line of code from your script in the console
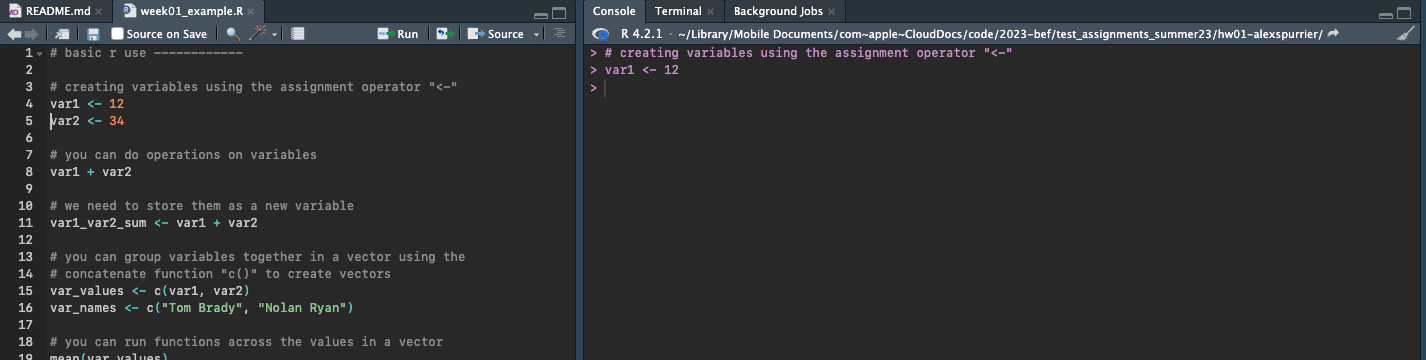
If your cursor is in the console, you can use the up/down arrows to cycle through previously executed code
What is git?
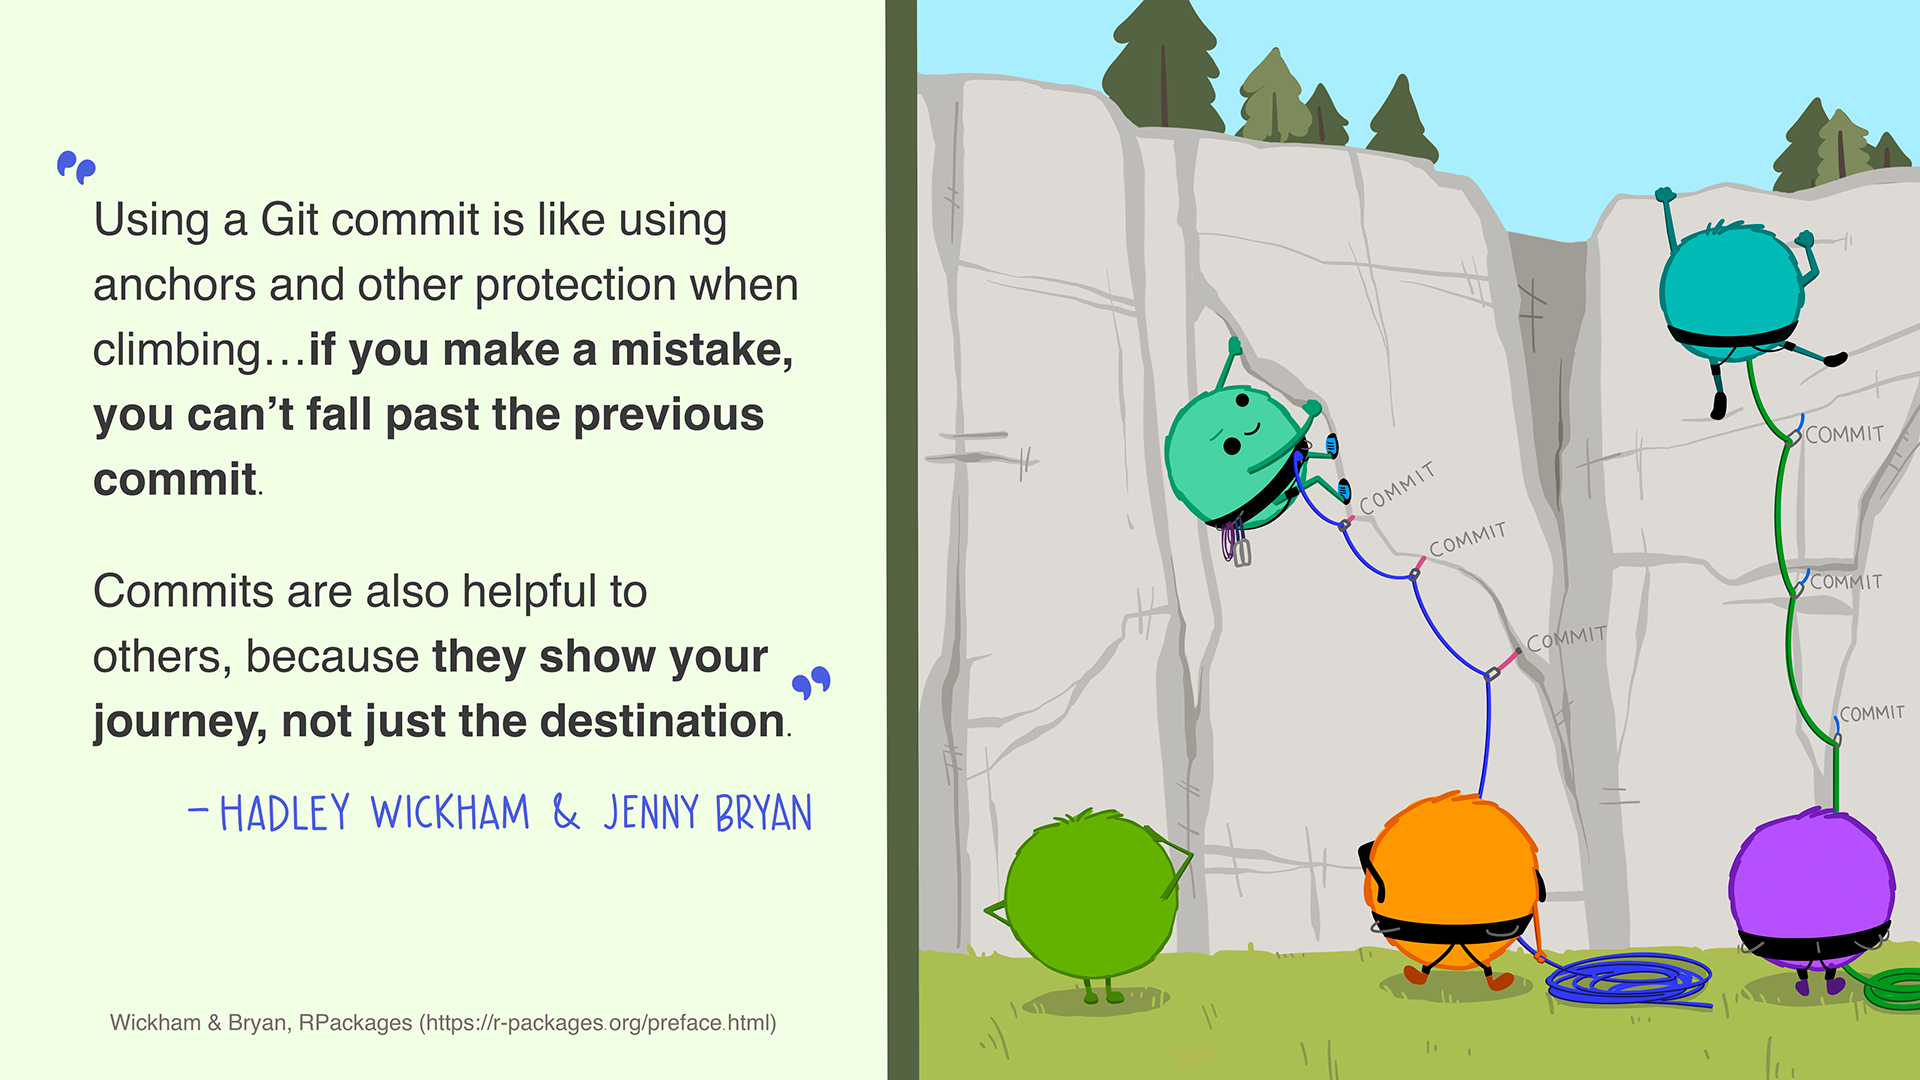
Git is version control software – it allows you to save (commit) changes to files and track those changes over time.
What is GitHub?
GitHub is to Git what RStudio is to R, but for file management.

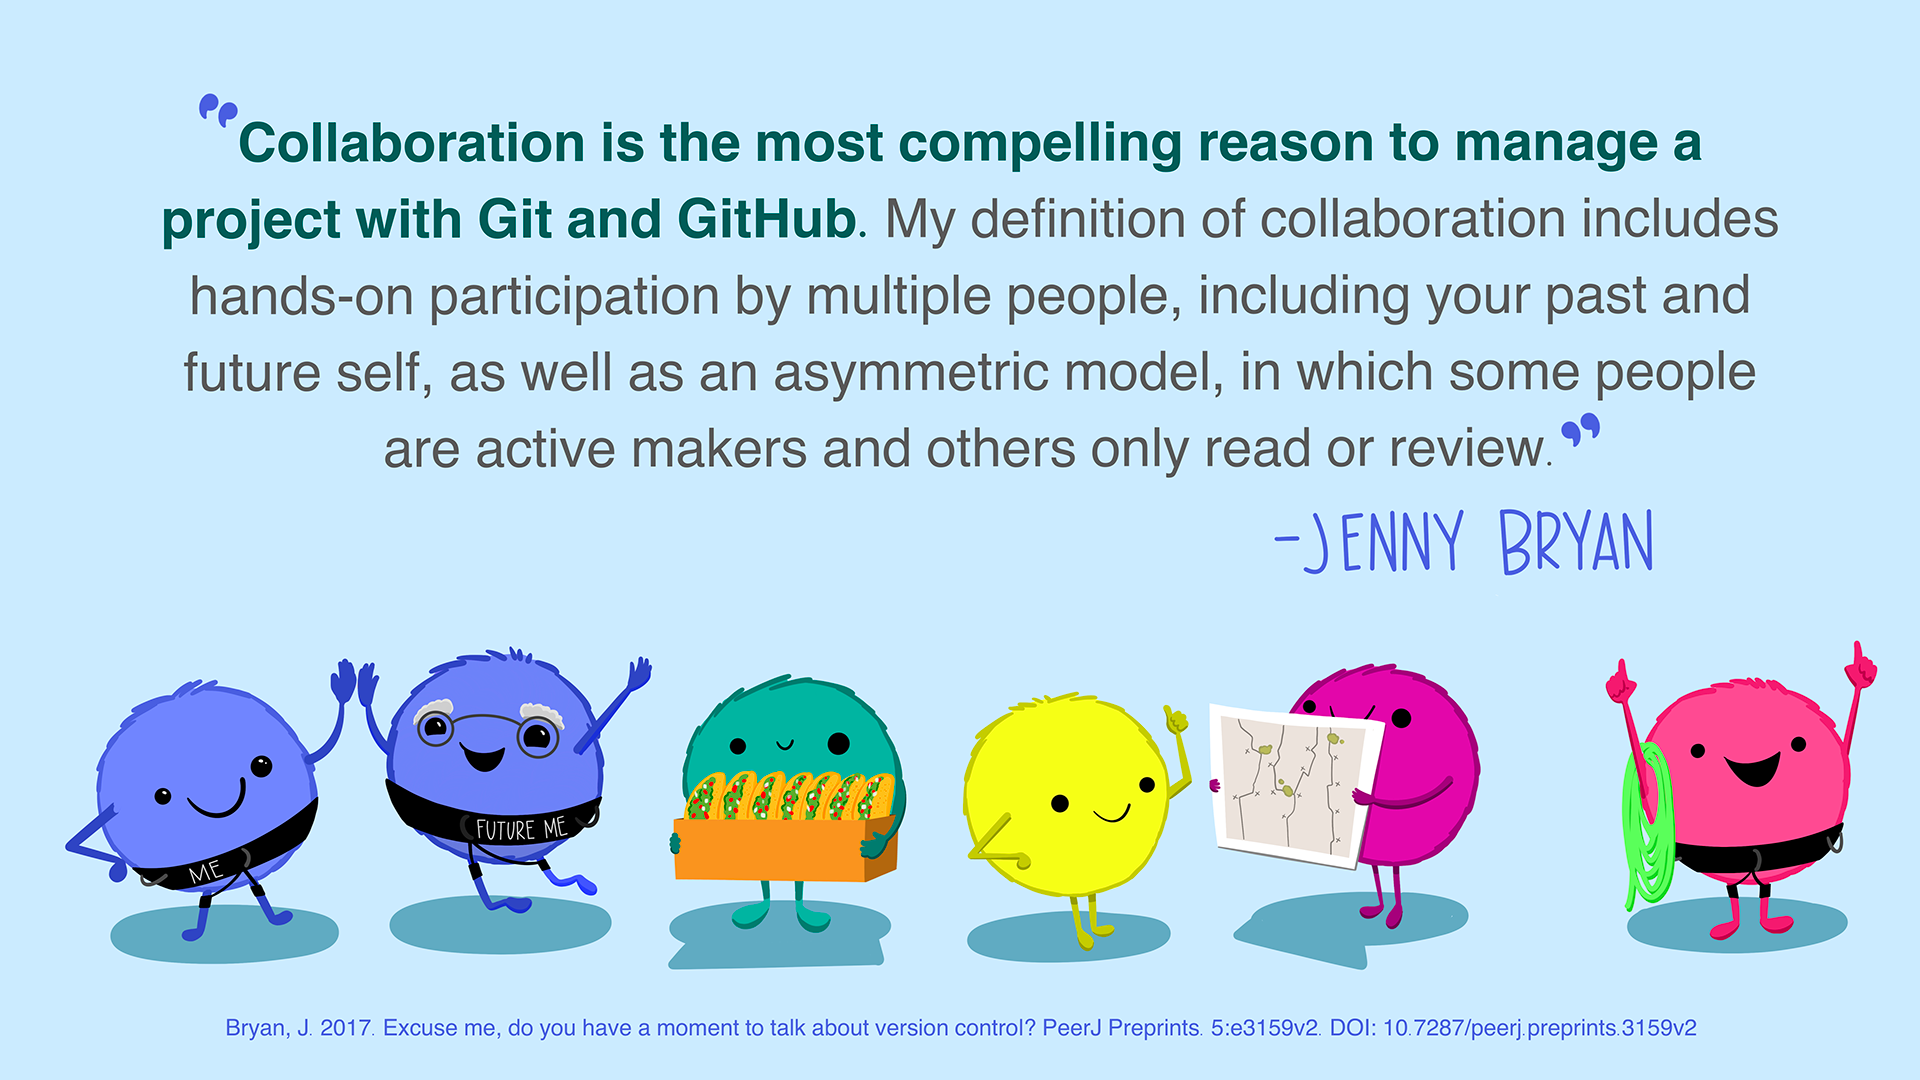
GitHub helps you collaborate with others, including past and future versions of yourself
We will use GitHub to distribute, collect, and collaborate on homework and capstone projects
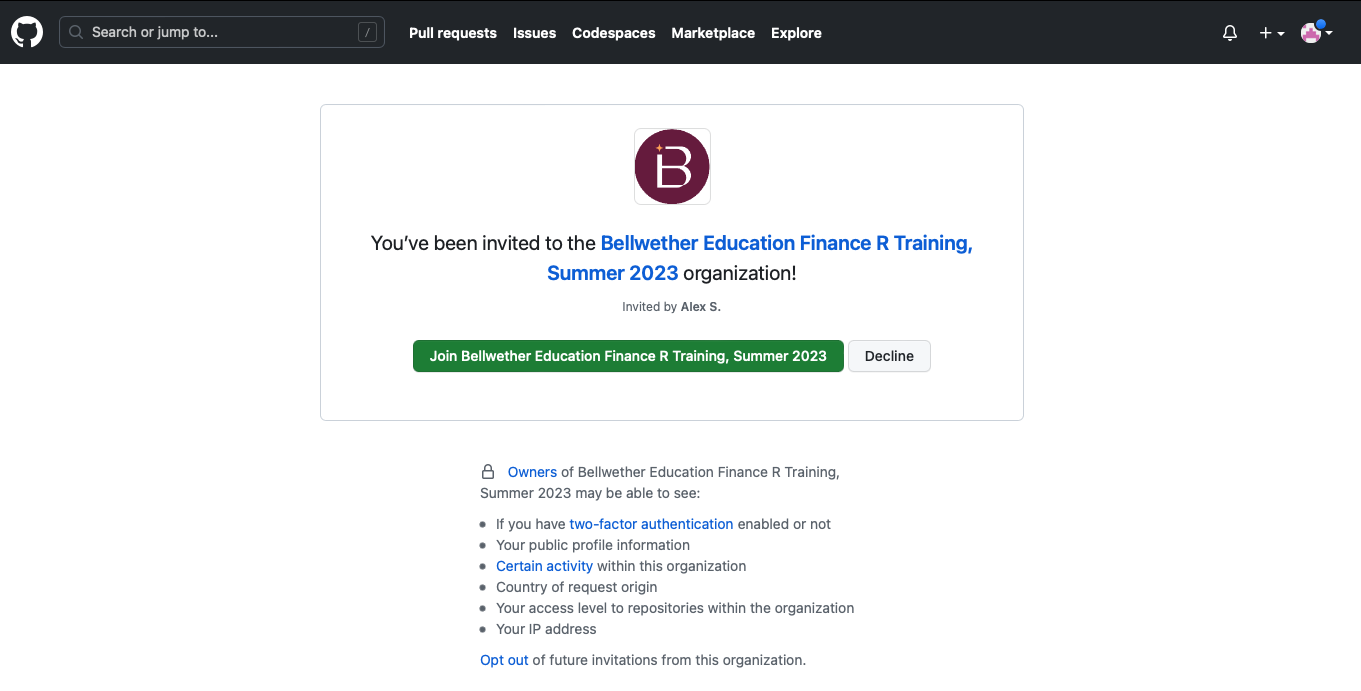
You’ll be recieving an email with an invitation to join the GitHub organization for this training
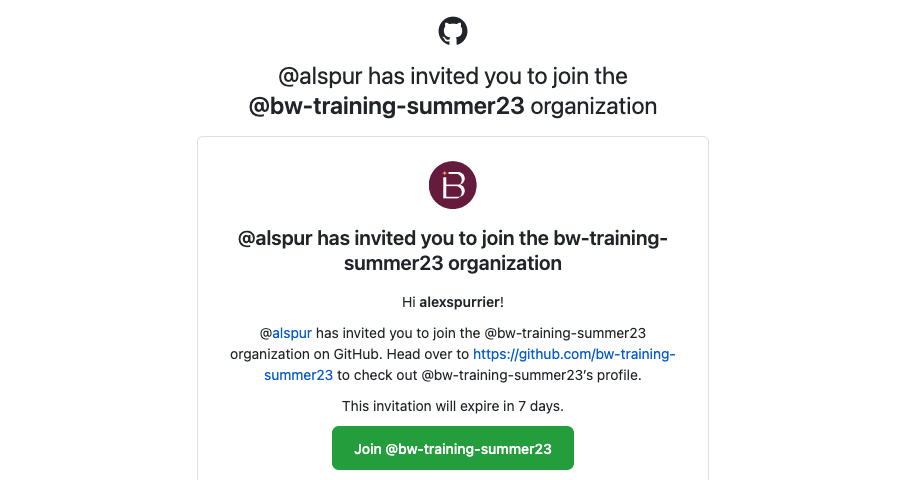
Once you click the green button, you’ll be directed to GitHub to join the organization
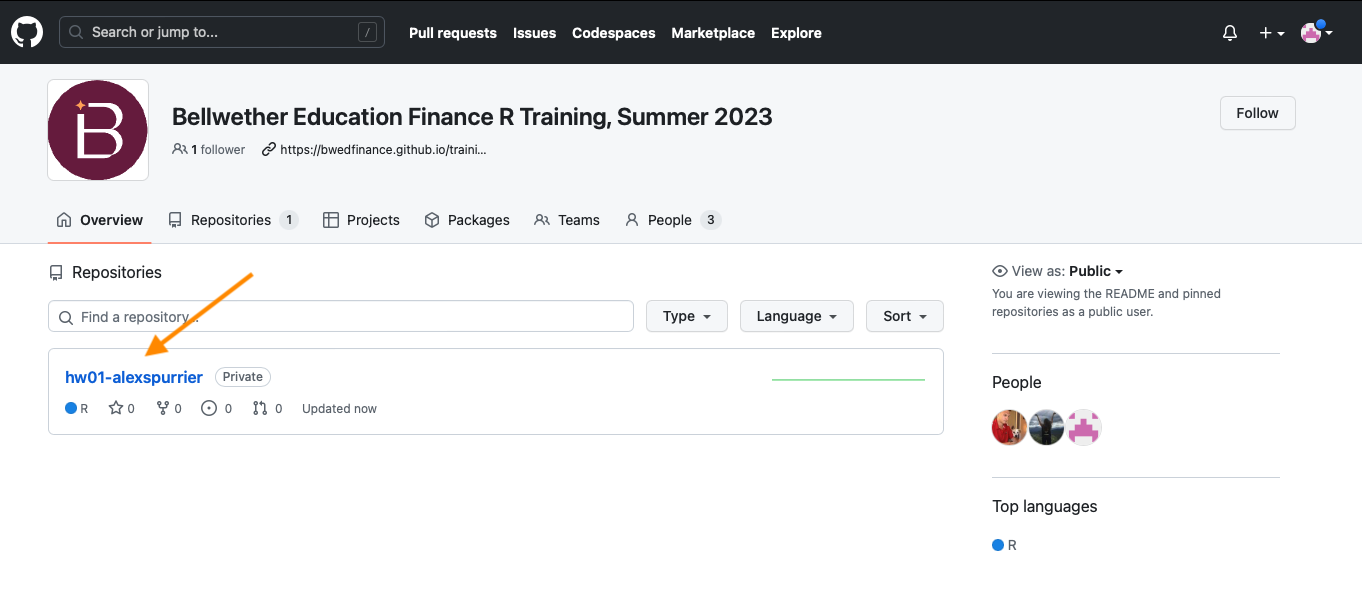
Bookmark the organization page – your homework assignments will show up here as repositories
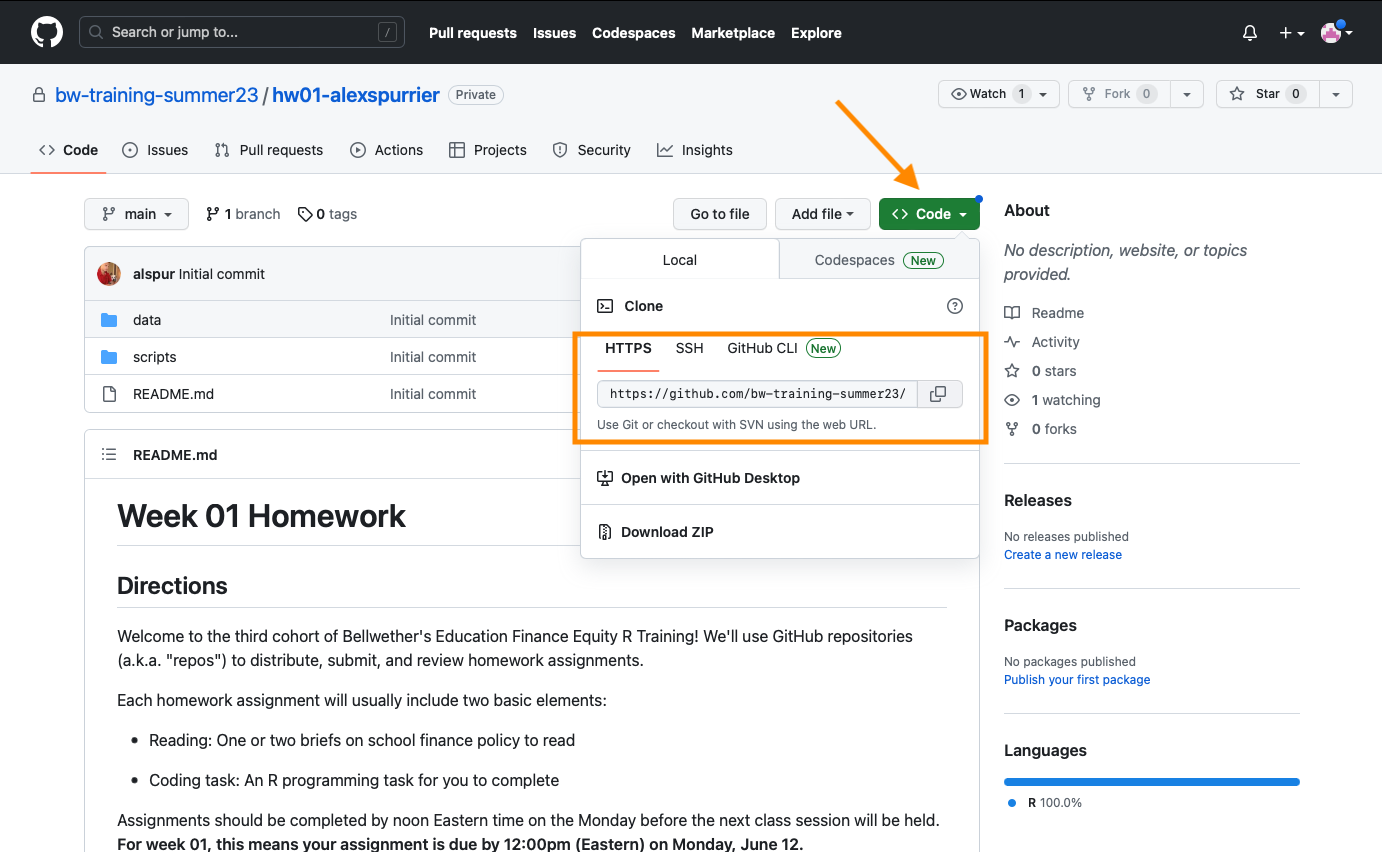
To start an assignment, navigate to the the repo and copy the HTTPS link that appears when you click the “Code” button
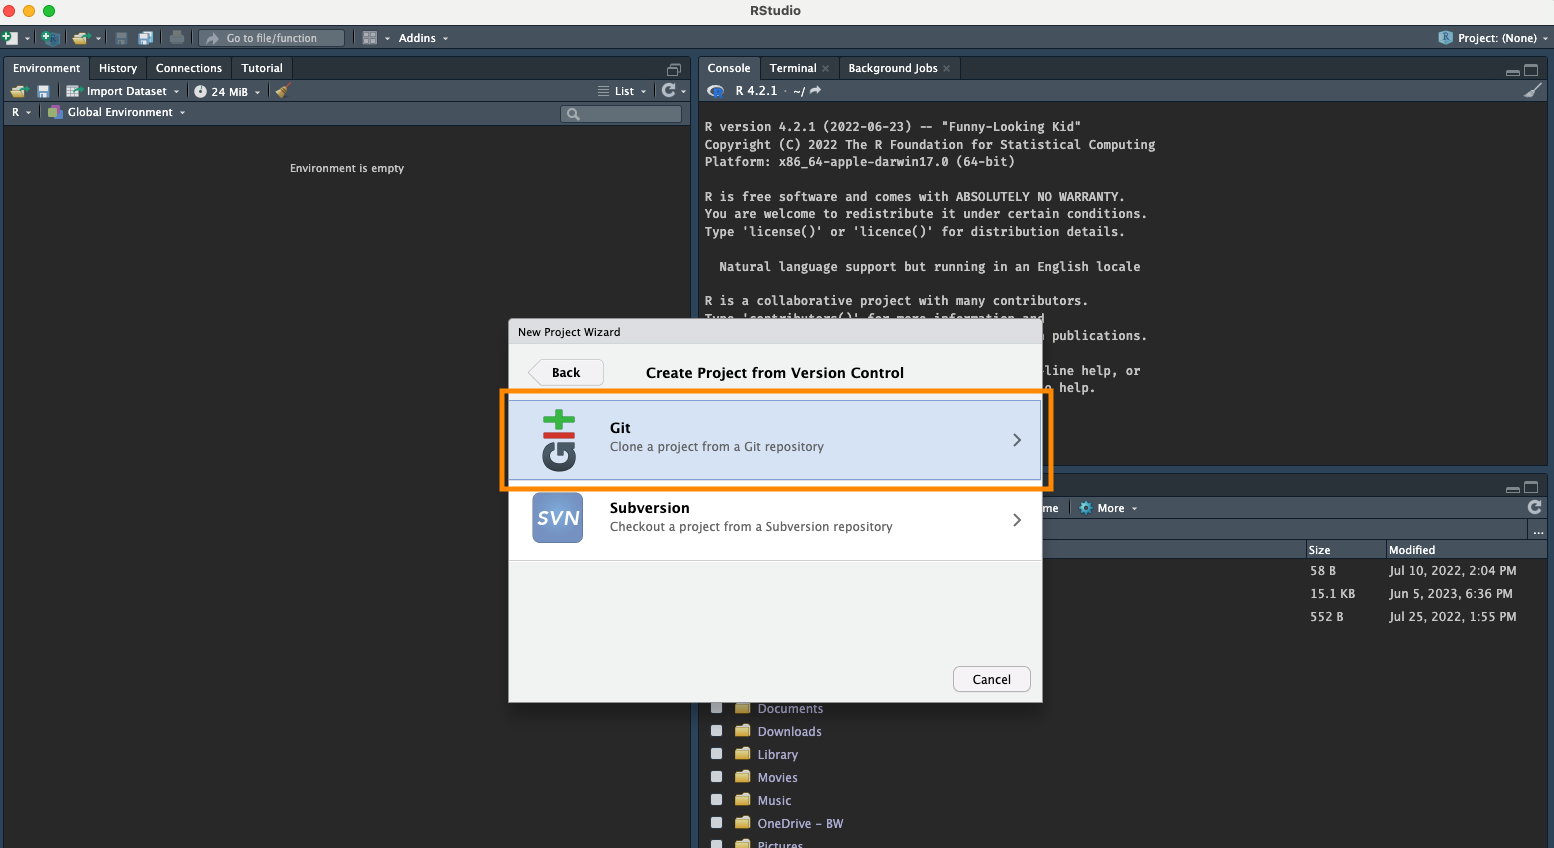
Next, you’ll open RStudio and create a new project, selecting the “Version Control” and “Git” options
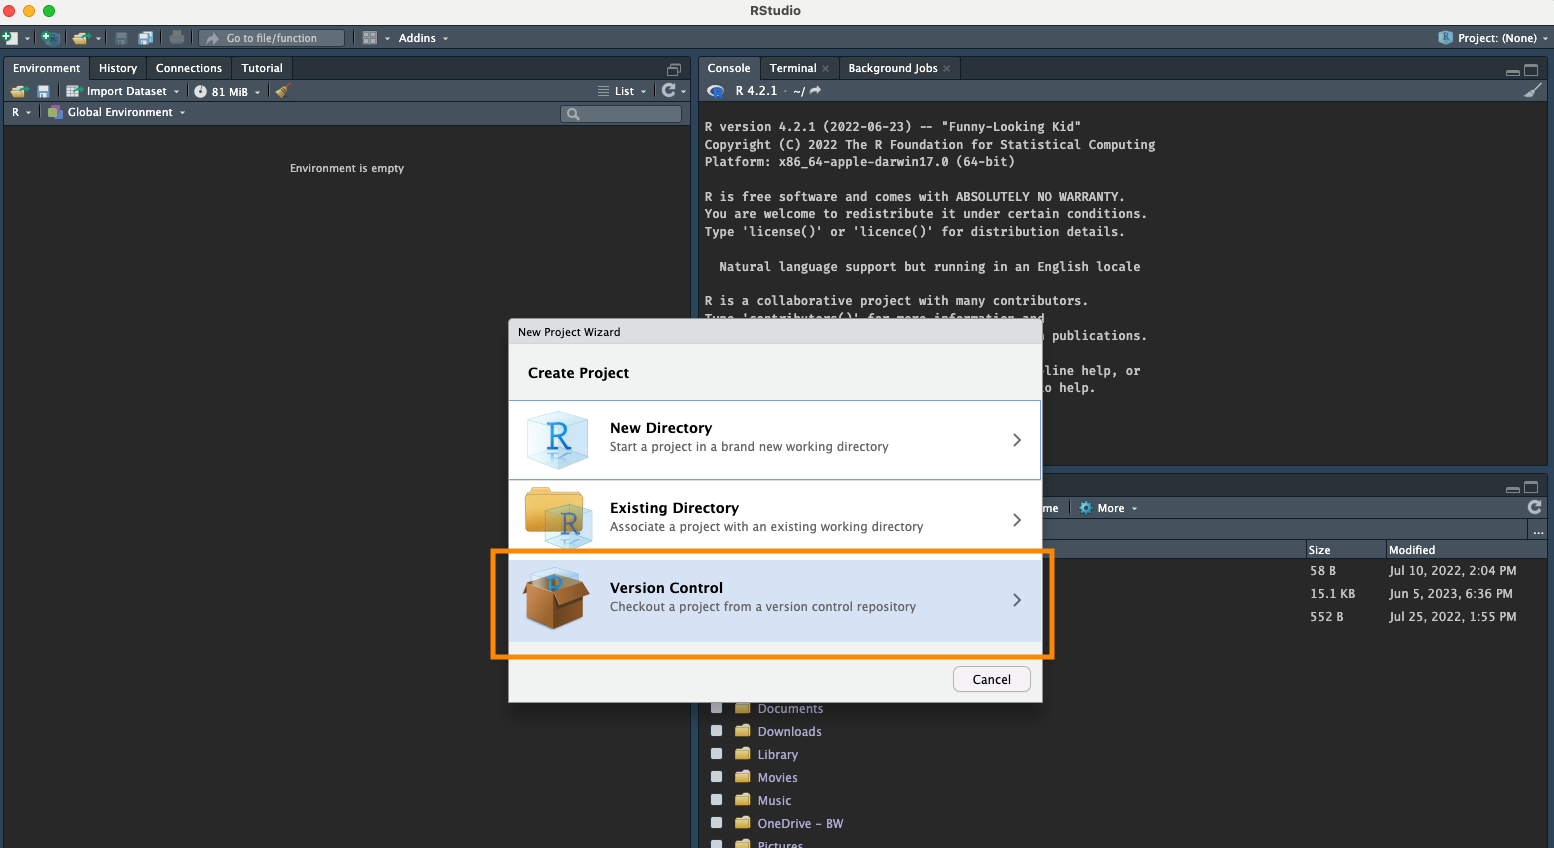
Next, you’ll open RStudio and create a new project, selecting the “Version Control” and “Git” options
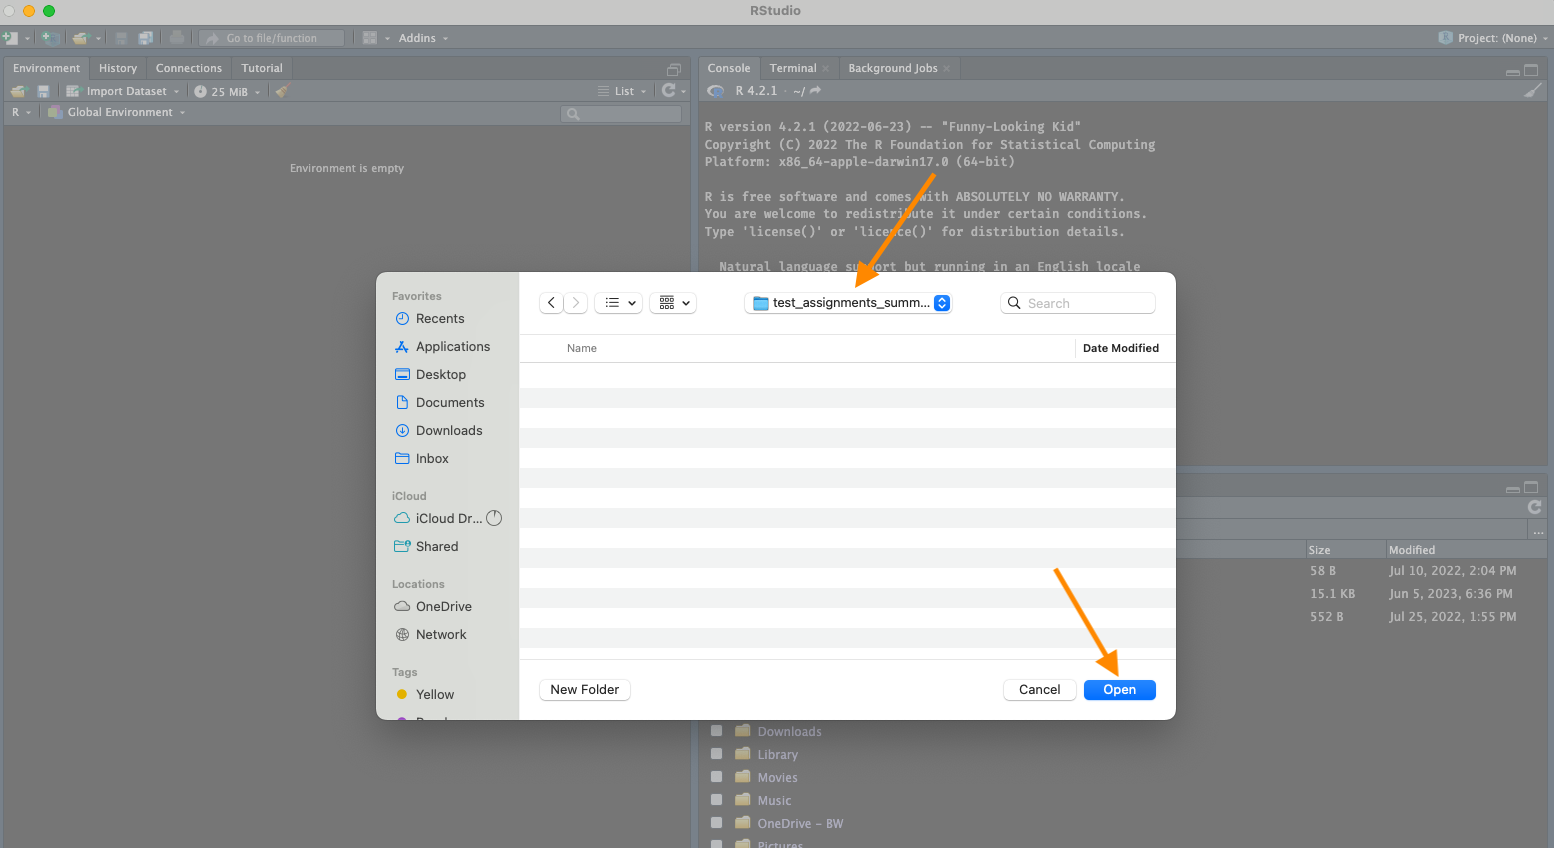
Be sure to select a folder where you want to have your homework files saved before you click “Open”
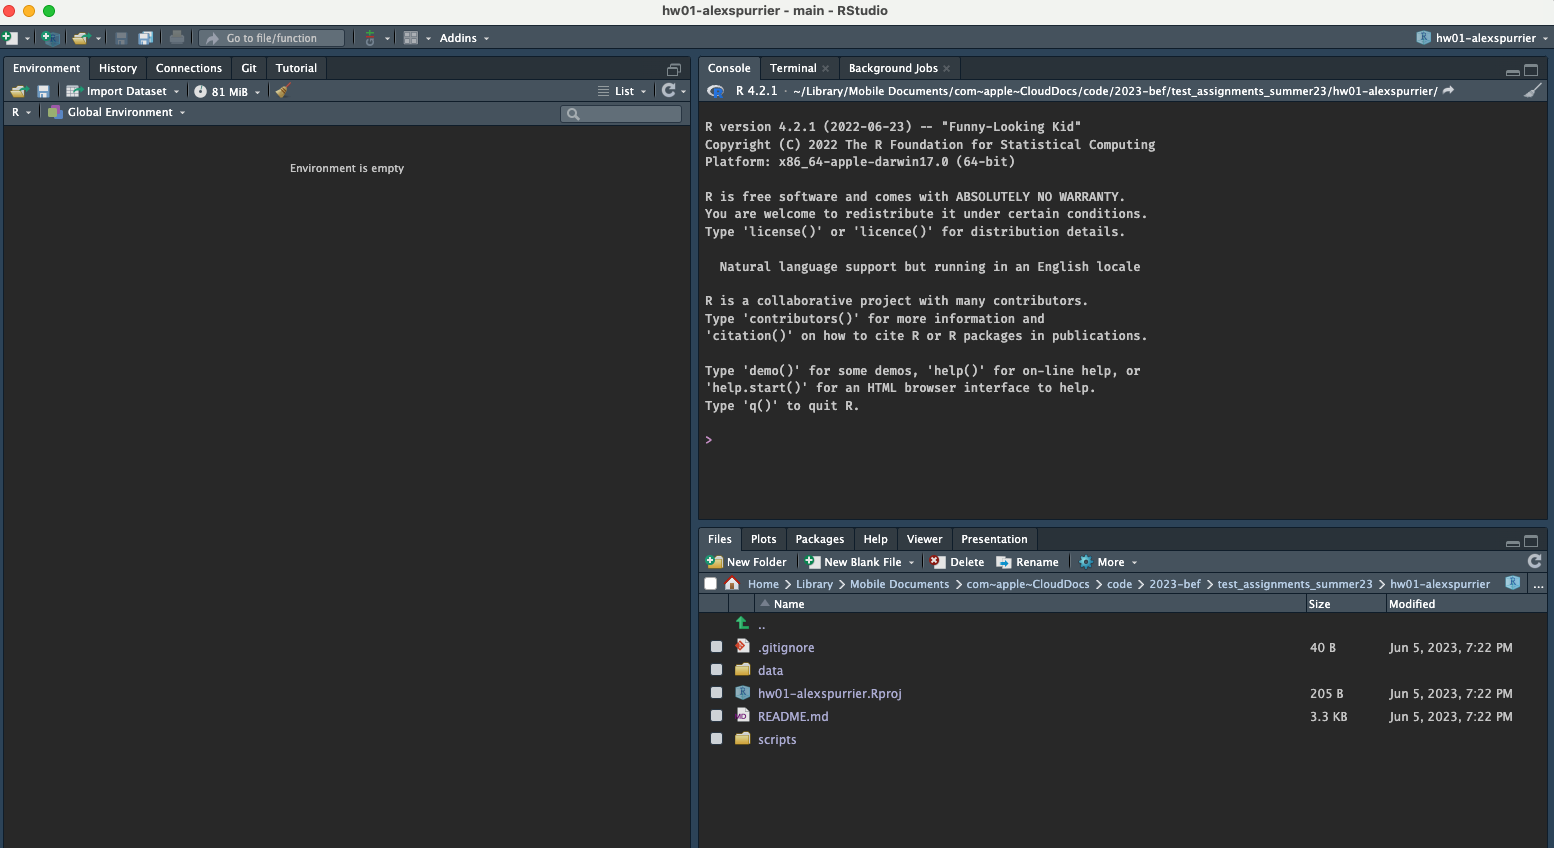
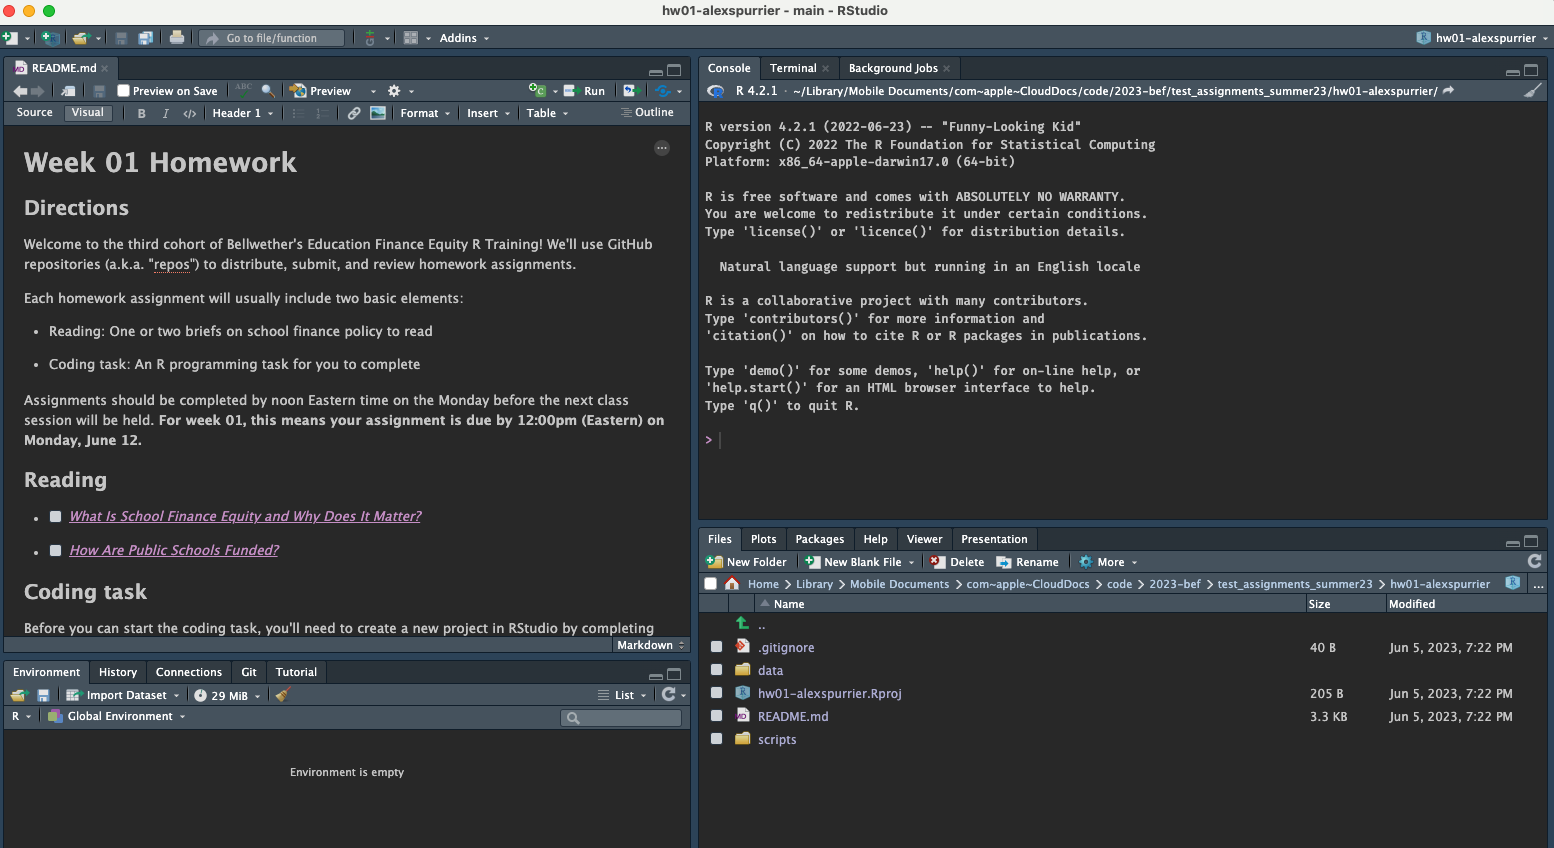
You’re now ready to start working on your homework! Start by opening the README.md file
The README.md file is a text file that will include instructions for your assignment – using the “Visual” option will make it easier to read
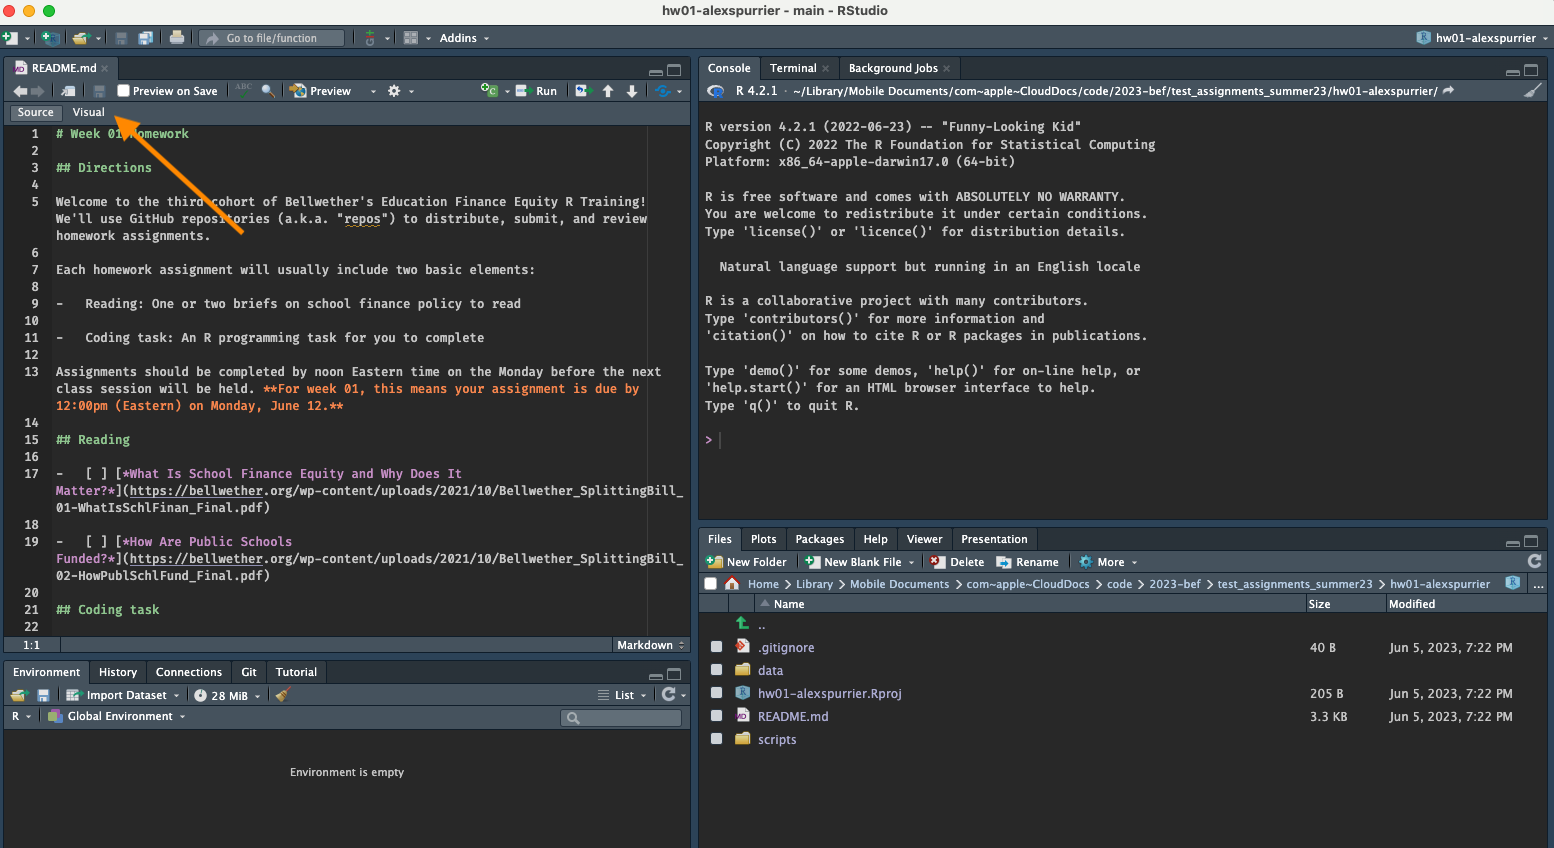
The README.md file is a text file that will include instructions for your assignment – using the “Visual” option will make it easier to read
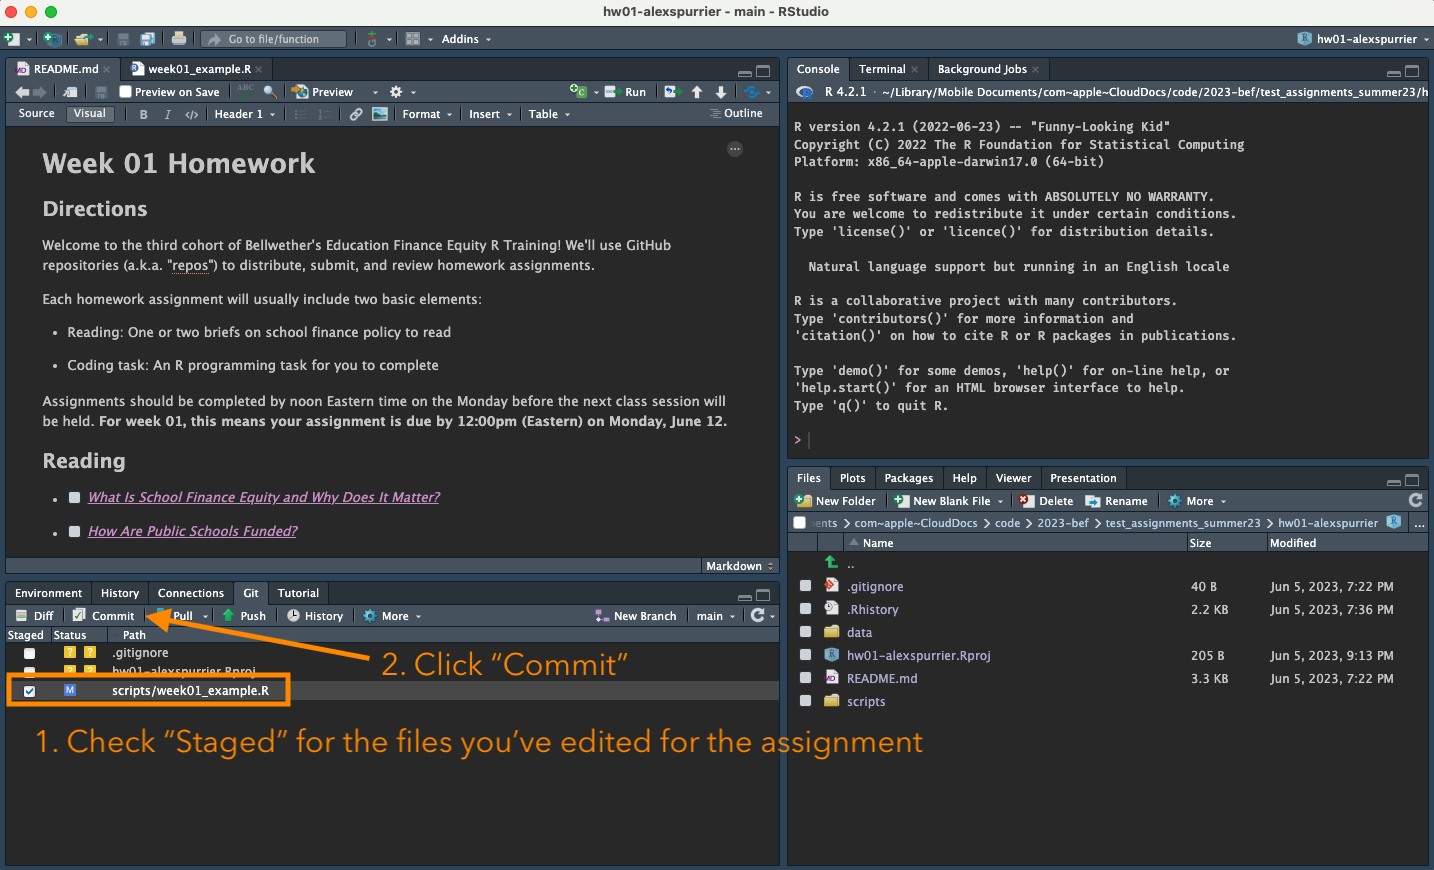
Once you’ve completed your assignment, you’ll want to “stage” the changes you’ve made
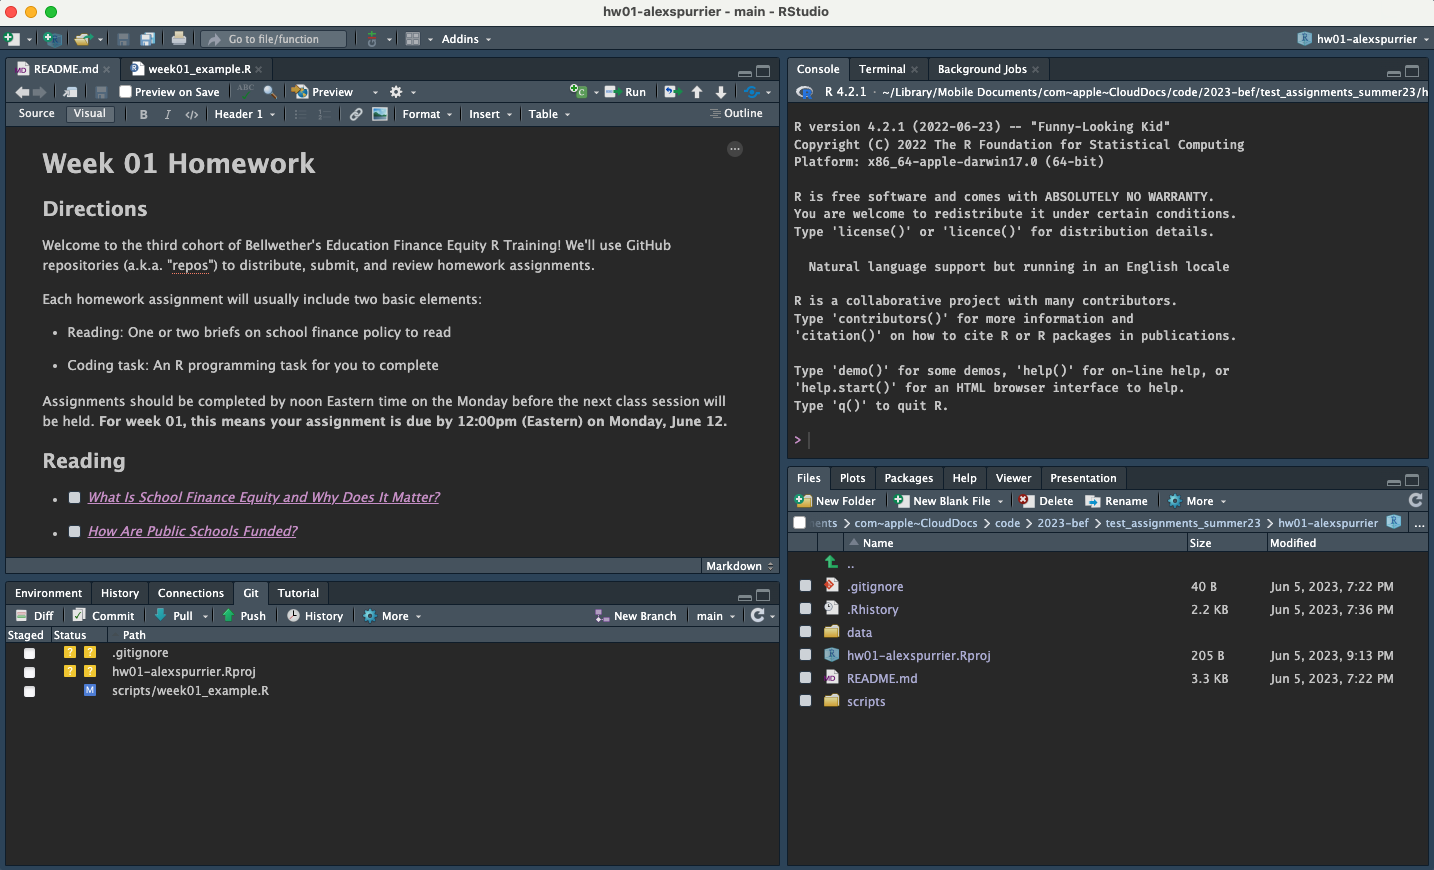
Once you’ve completed your assignment, you’ll want to “stage” your changes and then start the “commit” process
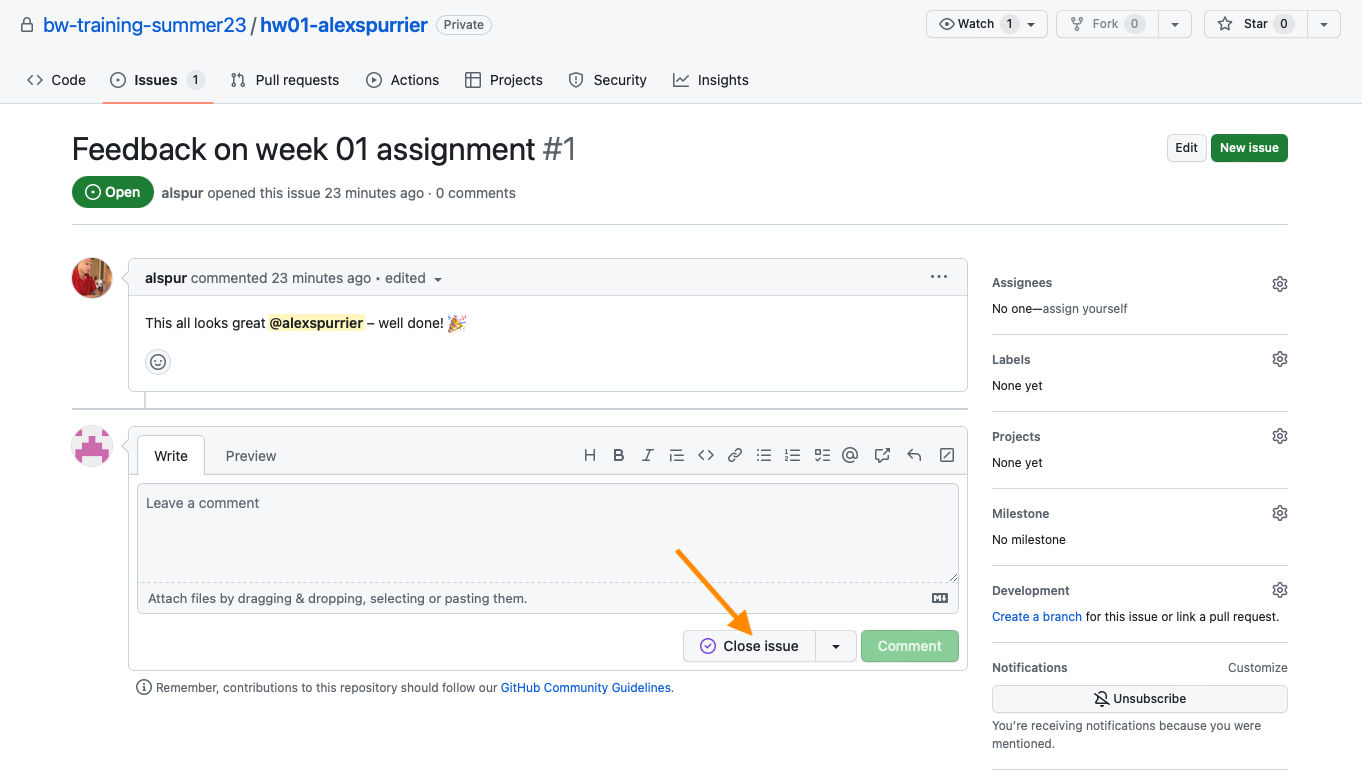
We’ll use GitHub’s “Issues” feature to share feedback on your work
After you receive an email notification that an issue was opened, you can click a link to view it on GitHub. On the issue page, you can respond if you have questions or click “Close issue” if no follow-up is needed.
This week’s assignment
Each homework assignment will usually include two basic elements:
Reading: One or two briefs on school finance policy to read
Coding task: An R programming task for you to complete
Assignments should be completed by noon Eastern time on the Monday before the next class session will be held. For week 01, this means your assignment is due by 12:00pm (Eastern) on Monday, June 12.
Reading
Coding Task
- Successfully copy the assignment repo to your computer
- Run and observe the example script from today’s class
- Create four new variables using the
median()function