# load -------
library(tidyverse)
library(ggplot2)

source("mn_example/scripts/2_mn_comprev_data.R")

# Build Compensatory Revenue Formula ------

## Calculate the compensatory revenue per school and rebuild the model
comprev_schools_model <- mn_comprev_final |>
        # Step 1: Split the reduced price student count in half because they are only worth .5 in the compensatory revenue formula
  mutate(comprev_reduced_count = reduced_lunch * .5,

         # Step 2:Add together the .5 reduced price count to the free count to get the corrected frpl number for the compensatory revenue formula
         comprev_frpl_reduced_total = comprev_reduced_count + free_lunch,

         comprev_frpl_reduced_pct = comprev_frpl_reduced_total / enroll, #This is the new frpl % with .5 reduced price count

         # Step 3: Divide by the weight factor by .8
         comprev_weight_factor_step = comprev_frpl_reduced_pct/.8,

         ### I'm keeping this interim step so that I can track it
         #Replace anything above 1 with 1 because of the formula
         comprev_weight_factor = ifelse(comprev_weight_factor_step > 1,
                                        1, comprev_weight_factor_step),

          # determine the compensatory revenue pupil unit count
         comprev_comp_pupil_unit = comprev_frpl_reduced_total * comprev_weight_factor * .6,

          # determine the amount of money that the school generates
         comprev_total = comprev_comp_pupil_unit * 5599,

          # per-pupil amount for the school that generates the funds
comprev_pp = comprev_total/frpl_total)Modeling state funding policy changes in R
2023-08-01
Homework Review
Overview of Homework
Modeling Potential Policy Changes in R
Over the past 8 weeks, you’ve learned how to use R to solve specific analysis problems
- Import, clean, and analyze large (and often messy) data sets
- Join multiple data sets together
- Create high-quality maps, scatter plots, and bar charts
- Model state funding policies
Today, you’ll learn how to model the impact of potential policy changes
While modeling current funding formulas is important to identify what’s working and areas for improvement, it’s also important to be able to model and visualize the potential impact of policy changes. This is important for several reasons:
- Allows you to assess potential financial impact at the state and district level
- Serves as a check to ensure that the intended student groups would be positively impacted or illustrate potential unintended consequences
- Can provide powerful data visualizations to illustrate the impact of the potential policy change
Before you start modeling your policy changes, make sure you clarify the problem you’d like to solve
- In what specific ways does current policy fall short?
- Which policy options should be considered as alternatives?
- How will you know if these alternative policies would be an improvement over current policy?
- Do you have the right data to answer these questions?
Once you have clear answers to these questions, it’s time to start modeling and assessing the impact of potential policy changes.
Minnesota Example: Overview of compensatory revenue
In class 7, we went over the fundamentals and thought processes for building Minnesota’s compensatory revenue formula, which is the state’s funding stream for low-income students. Minnesota invests $551 million annually in compensatory revenue, which are state funds that are supposed to support the academic achievement of students who are not meeting state standards. There are three main policy issues with the current funding formula:
- Students who qualify for Reduced Price Lunch are weighted as 0.5.
- Schools where more than 80% of their students are in poverty do not see increases in per pupil compensatory revenue.
- Districts are allowed to keep 50% of the compensatory revenue funds and reallocate it as they see fit, which means that the schools that generate the funds only 50% of the dollars that are meant for their students. This takes away funding—and subsequently support—from the students who generate the dollars and need it the most.
Turning back to our questions: Are we ready to start modeling?
- In what specific ways does current policy fall short?
- Reduced price weight
- 80% cap
- District reallocation of 50% of funding
- Which policy options should be considered as alternatives?
- Remove the cap
- Increase the reduced price weight from .5 to .75
- How will you know if these alternative policies would be an improvement over current policy?
- More revenue going to the highest-poverty schools
- Do you have the right data to answer these questions?
- Yes!
Minnesota Example: Model current compensatory revenue funding stream
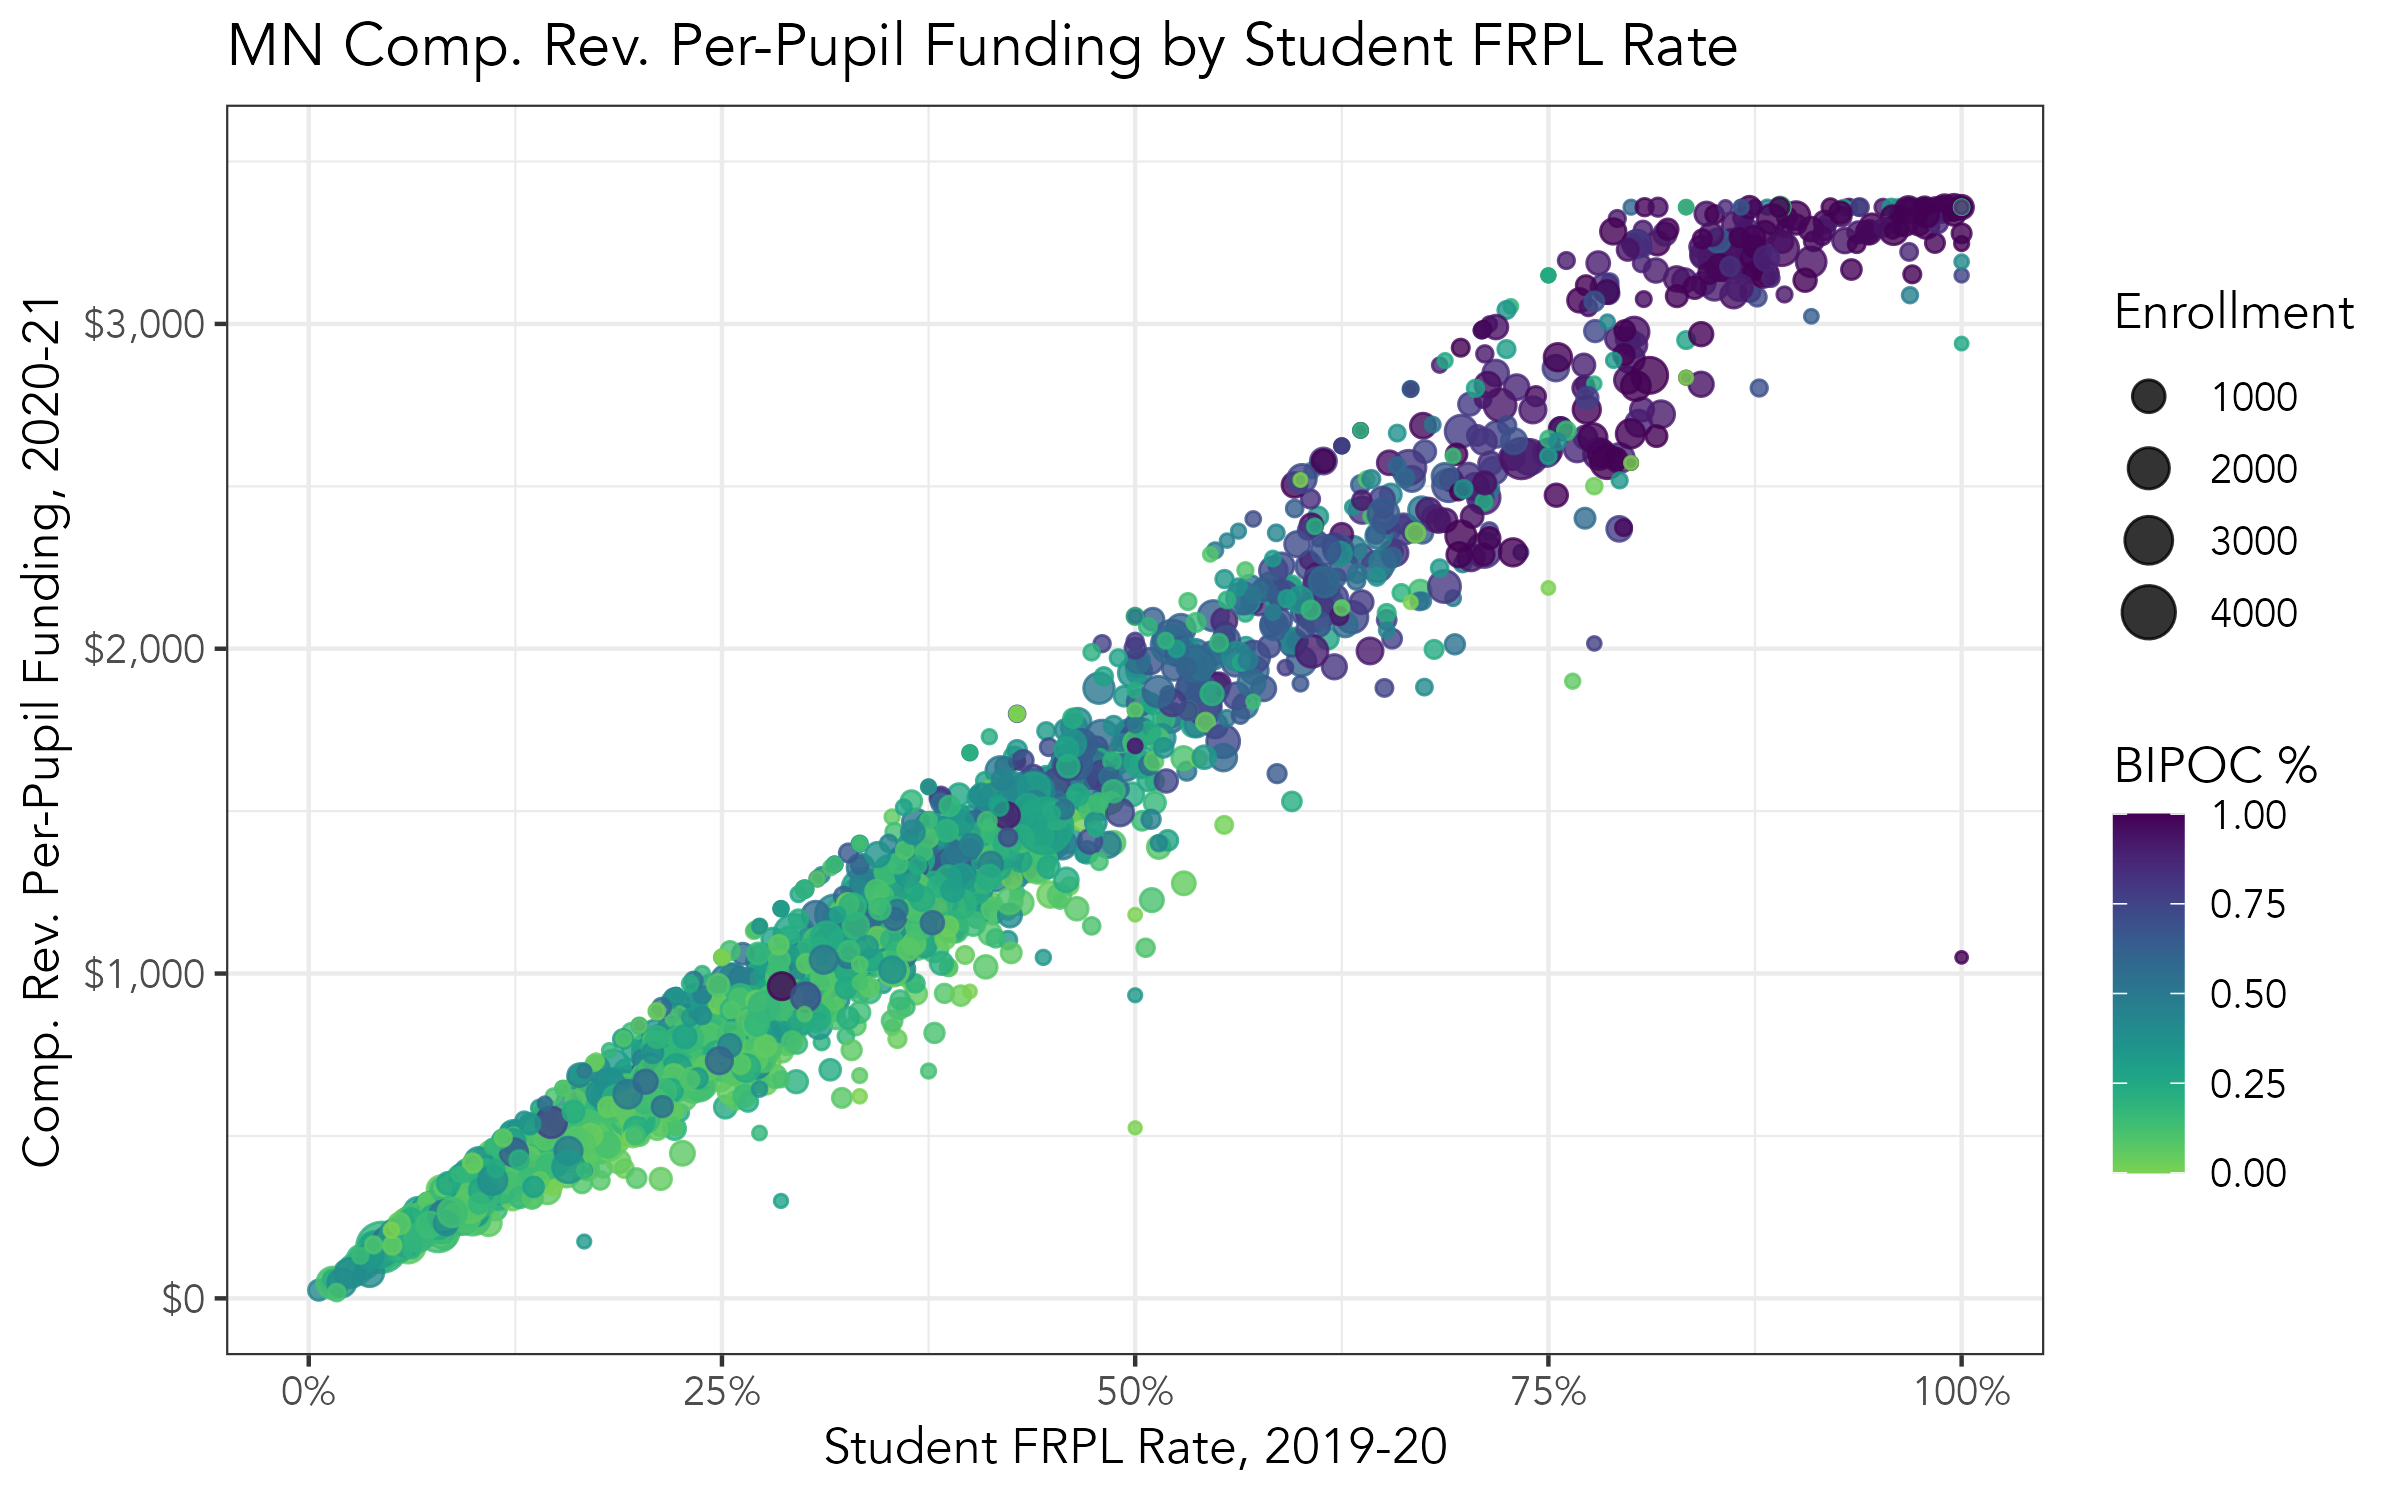
Scatterplot of the current compensatory revenue formula illustrates some of the issues

Minnesota Example: Lifting the 80% cap on per-pupil funding
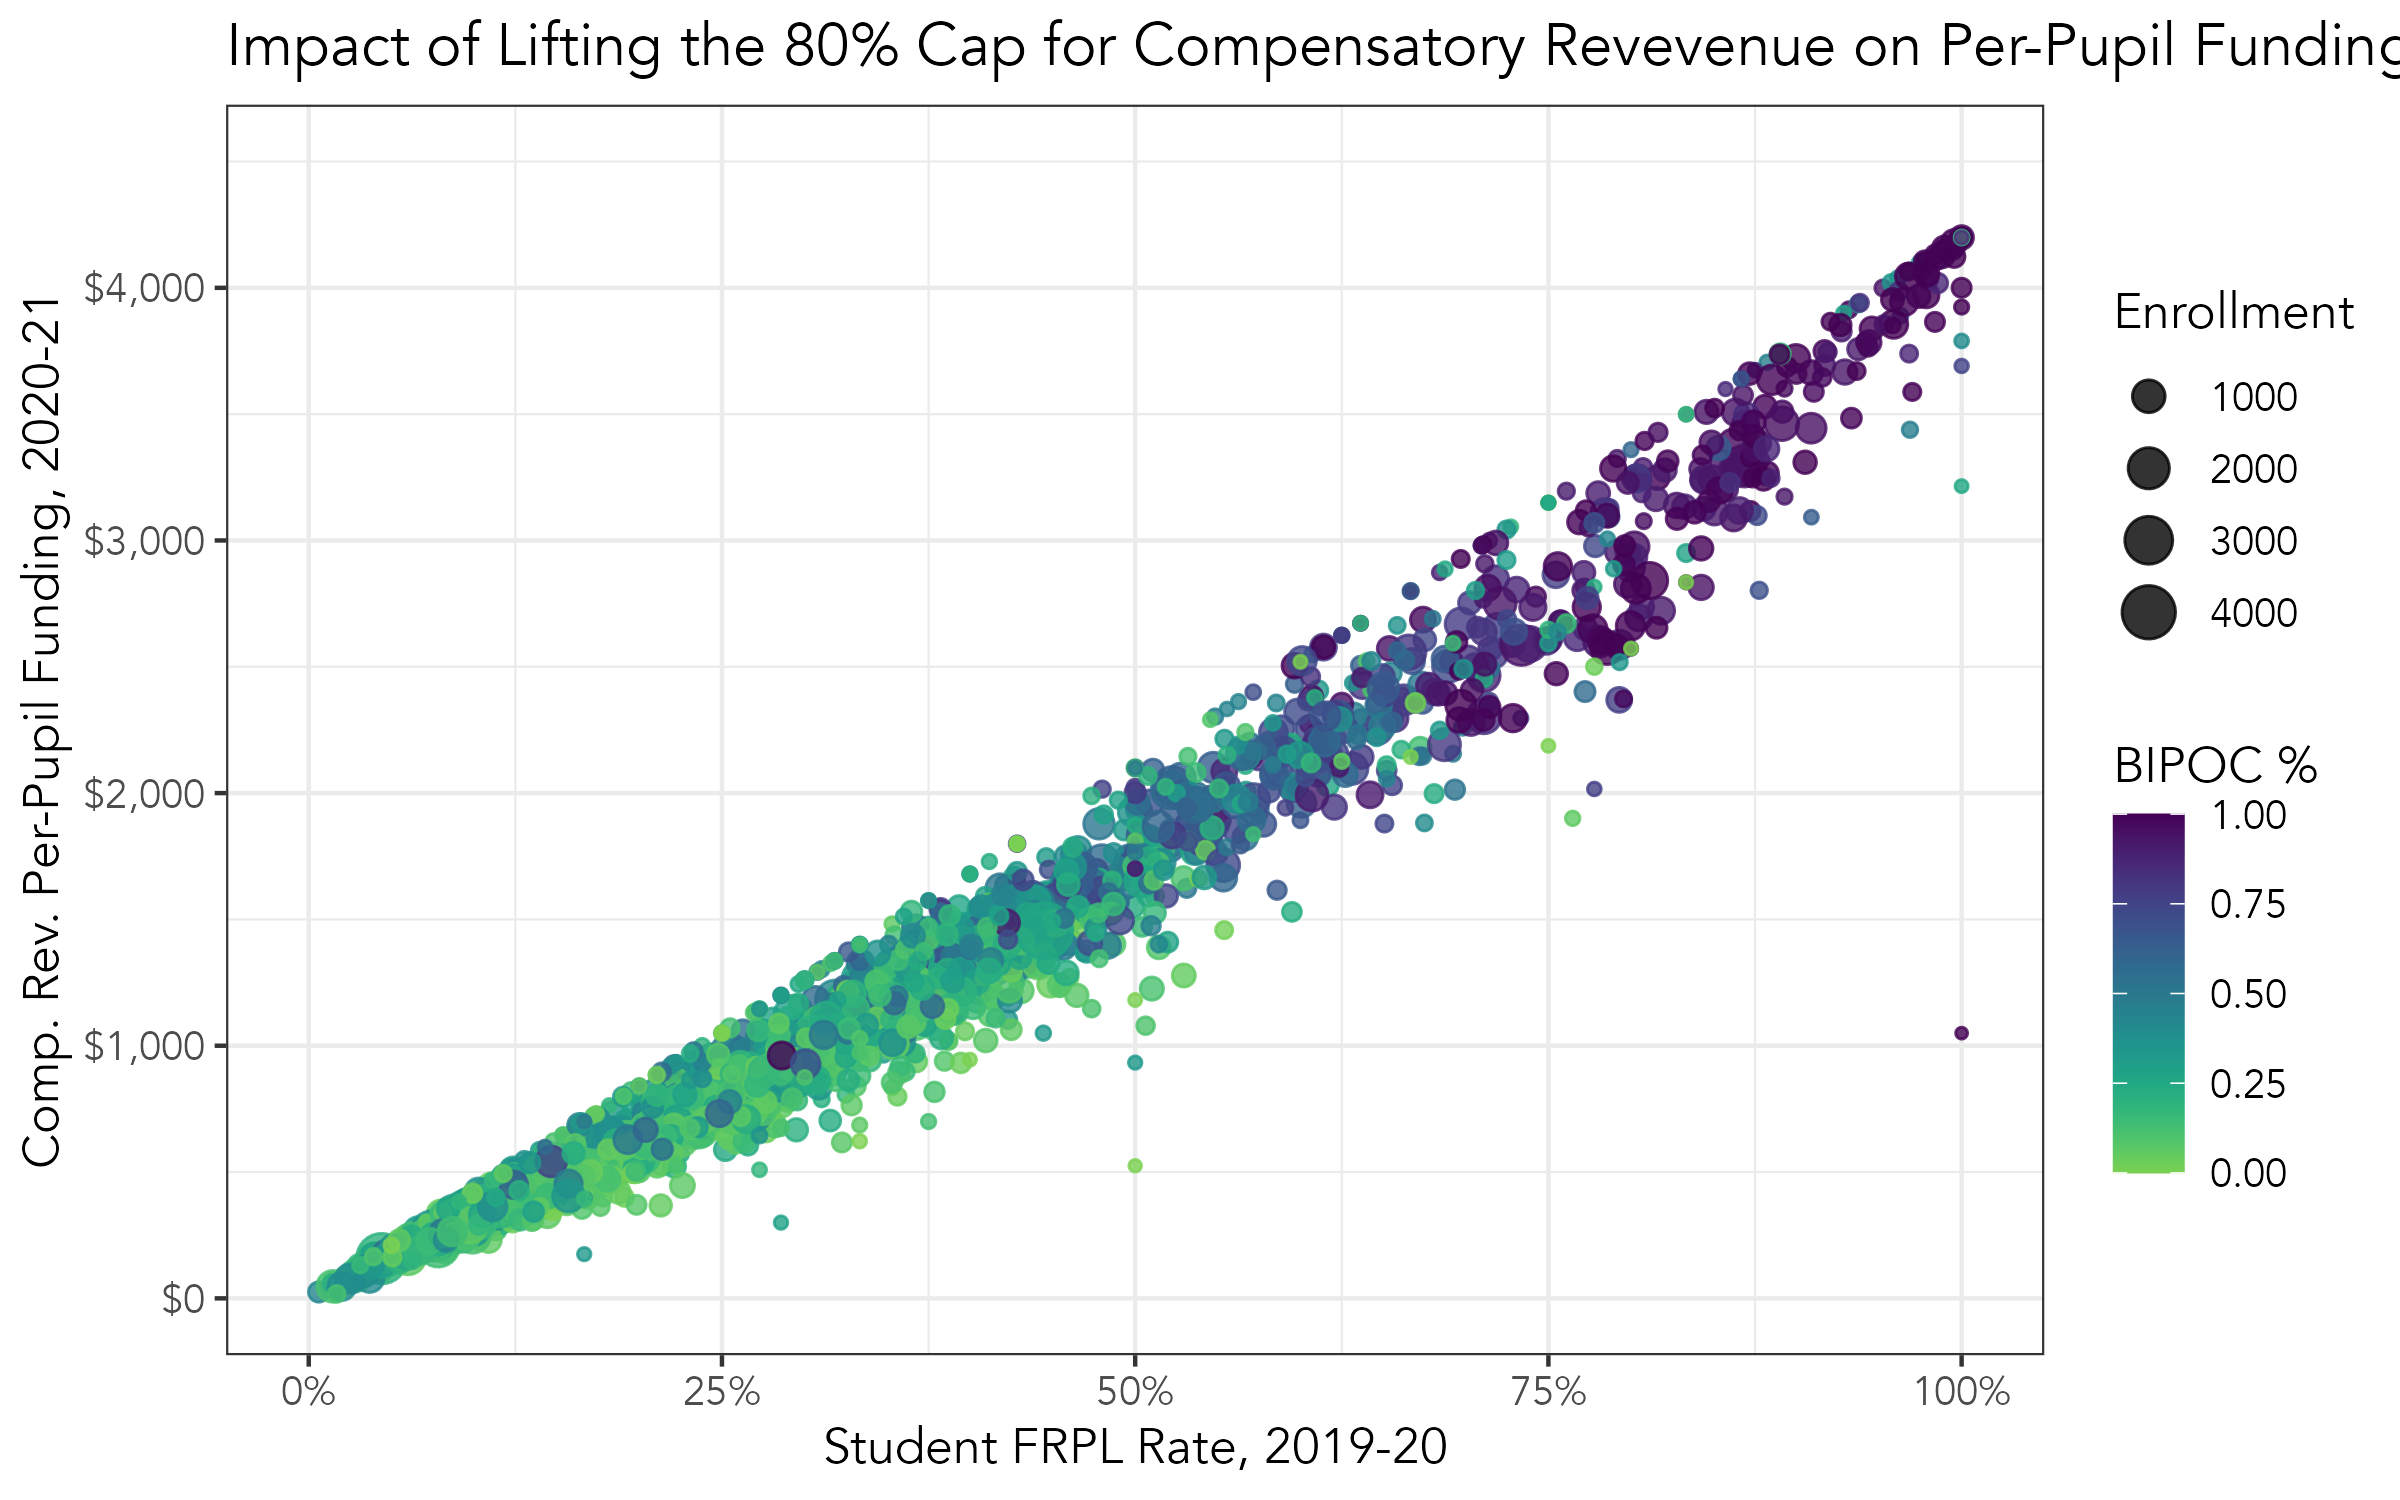
The 80% cap on per-pupil funding has a large impact on schools that serve 80% or more low-income students. Lifting the cap, would provide 150 charter and district schools that serve the largest concentrations of students in poverty and only cost the state about $10 million annually.
Modeling the potential change in R is simple - we just have to comment out the line that changes the compensatory revenue weight factor.
# Modeling Policy Changes  ------

## Policy Change #1: Lift the 80% cap
#To lift the cap, I will take the original data and not change the compensatory weight factor to 1 if it's above 1

comprev_schools_policy_1 <- comprev_schools_model |>

  mutate(comprev_reduced_count = reduced_lunch * .5,

         comprev_frpl_reduced_total = comprev_reduced_count + free_lunch,

         comprev_frpl_reduced_pct = comprev_frpl_reduced_total / enroll,

         comprev_weight_factor_step = comprev_frpl_reduced_pct / .8,

         # I commented out this code because we are no longer capping it at 1
         # comprev_weight_factor = ifelse(comprev_weight_factor_step > 1,
         #                                1, comprev_weight_factor_step),

          # determine the compensatory revenue pupil unit count
         comprev_comp_pupil_unit_policy_1 = comprev_frpl_reduced_total * comprev_weight_factor * .6,

          # determine the amount of money that the school generates
         comprev_total_policy_1 = comprev_comp_pupil_unit * 5599,

          # per-pupil amount for the school that generates the funds
         comprev_pp_policy1 = comprev_total_policy1 / frpl_total)
The impact of lifting the 80% on per-pupil funding
The scatterplot illustrates that schools that have 80%+ low-income students are now receiving an increase in per-pupil funding.

Minnesota Example: Increase the weight of reduced price lunch students
Increasing the statutory amount a reduced priced student counts from 0.5 to 0.75 would be more in line with the percentage difference between free and reduced price lunch income cutoffs for a family of four.
Increasing the reduced price lunch weight would benefit more than 1,600 schools and would cost the state about $30 million annually.
# Modeling Policy Changes  ------

## Policy Change #2: Increase reduced price lunch weight from 0.5 to 0.75

comprev_schools_policy_2 <- comprev_schools_model |>

   # I changed the number from 0.5 to 0.75
  mutate(comprev_reduced_count_policy2 = reduced_lunch * .75,

         comprev_frpl_reduced_total_policy2 = comprev_reduced_count_policy2 + free_lunch,

         comprev_frpl_reduced_pct_policy2 = comprev_frpl_reduced_total_policy2 / enroll,

         comprev_weight_factor_step_policy2 = comprev_frpl_reduced_pct_policy2 / .8,


        comprev_weight_factor_policy2 = ifelse(comprev_weight_factor_step_policy2 > 1,
                                        1, comprev_weight_factor_step_policy2),

          # determine the compensatory revenue pupil unit count
         comprev_comp_pupil_unit_policy_2 = comprev_frpl_reduced_total * comprev_weight_factor_policy2 * .6,

          # determine the amount of money that the school generates
         comprev_total_policy_2 = comprev_comp_pupil_unit_policy_2 * 5599,

          # per-pupil amount for the school that generates the funds
         comprev_pp_policy2 = comprev_total_policy2 / frpl_total,

          # Calculate the per-pupil increase in funding
        policy2_pp_increase = comprev_pp_policy2 - comprev_pp)
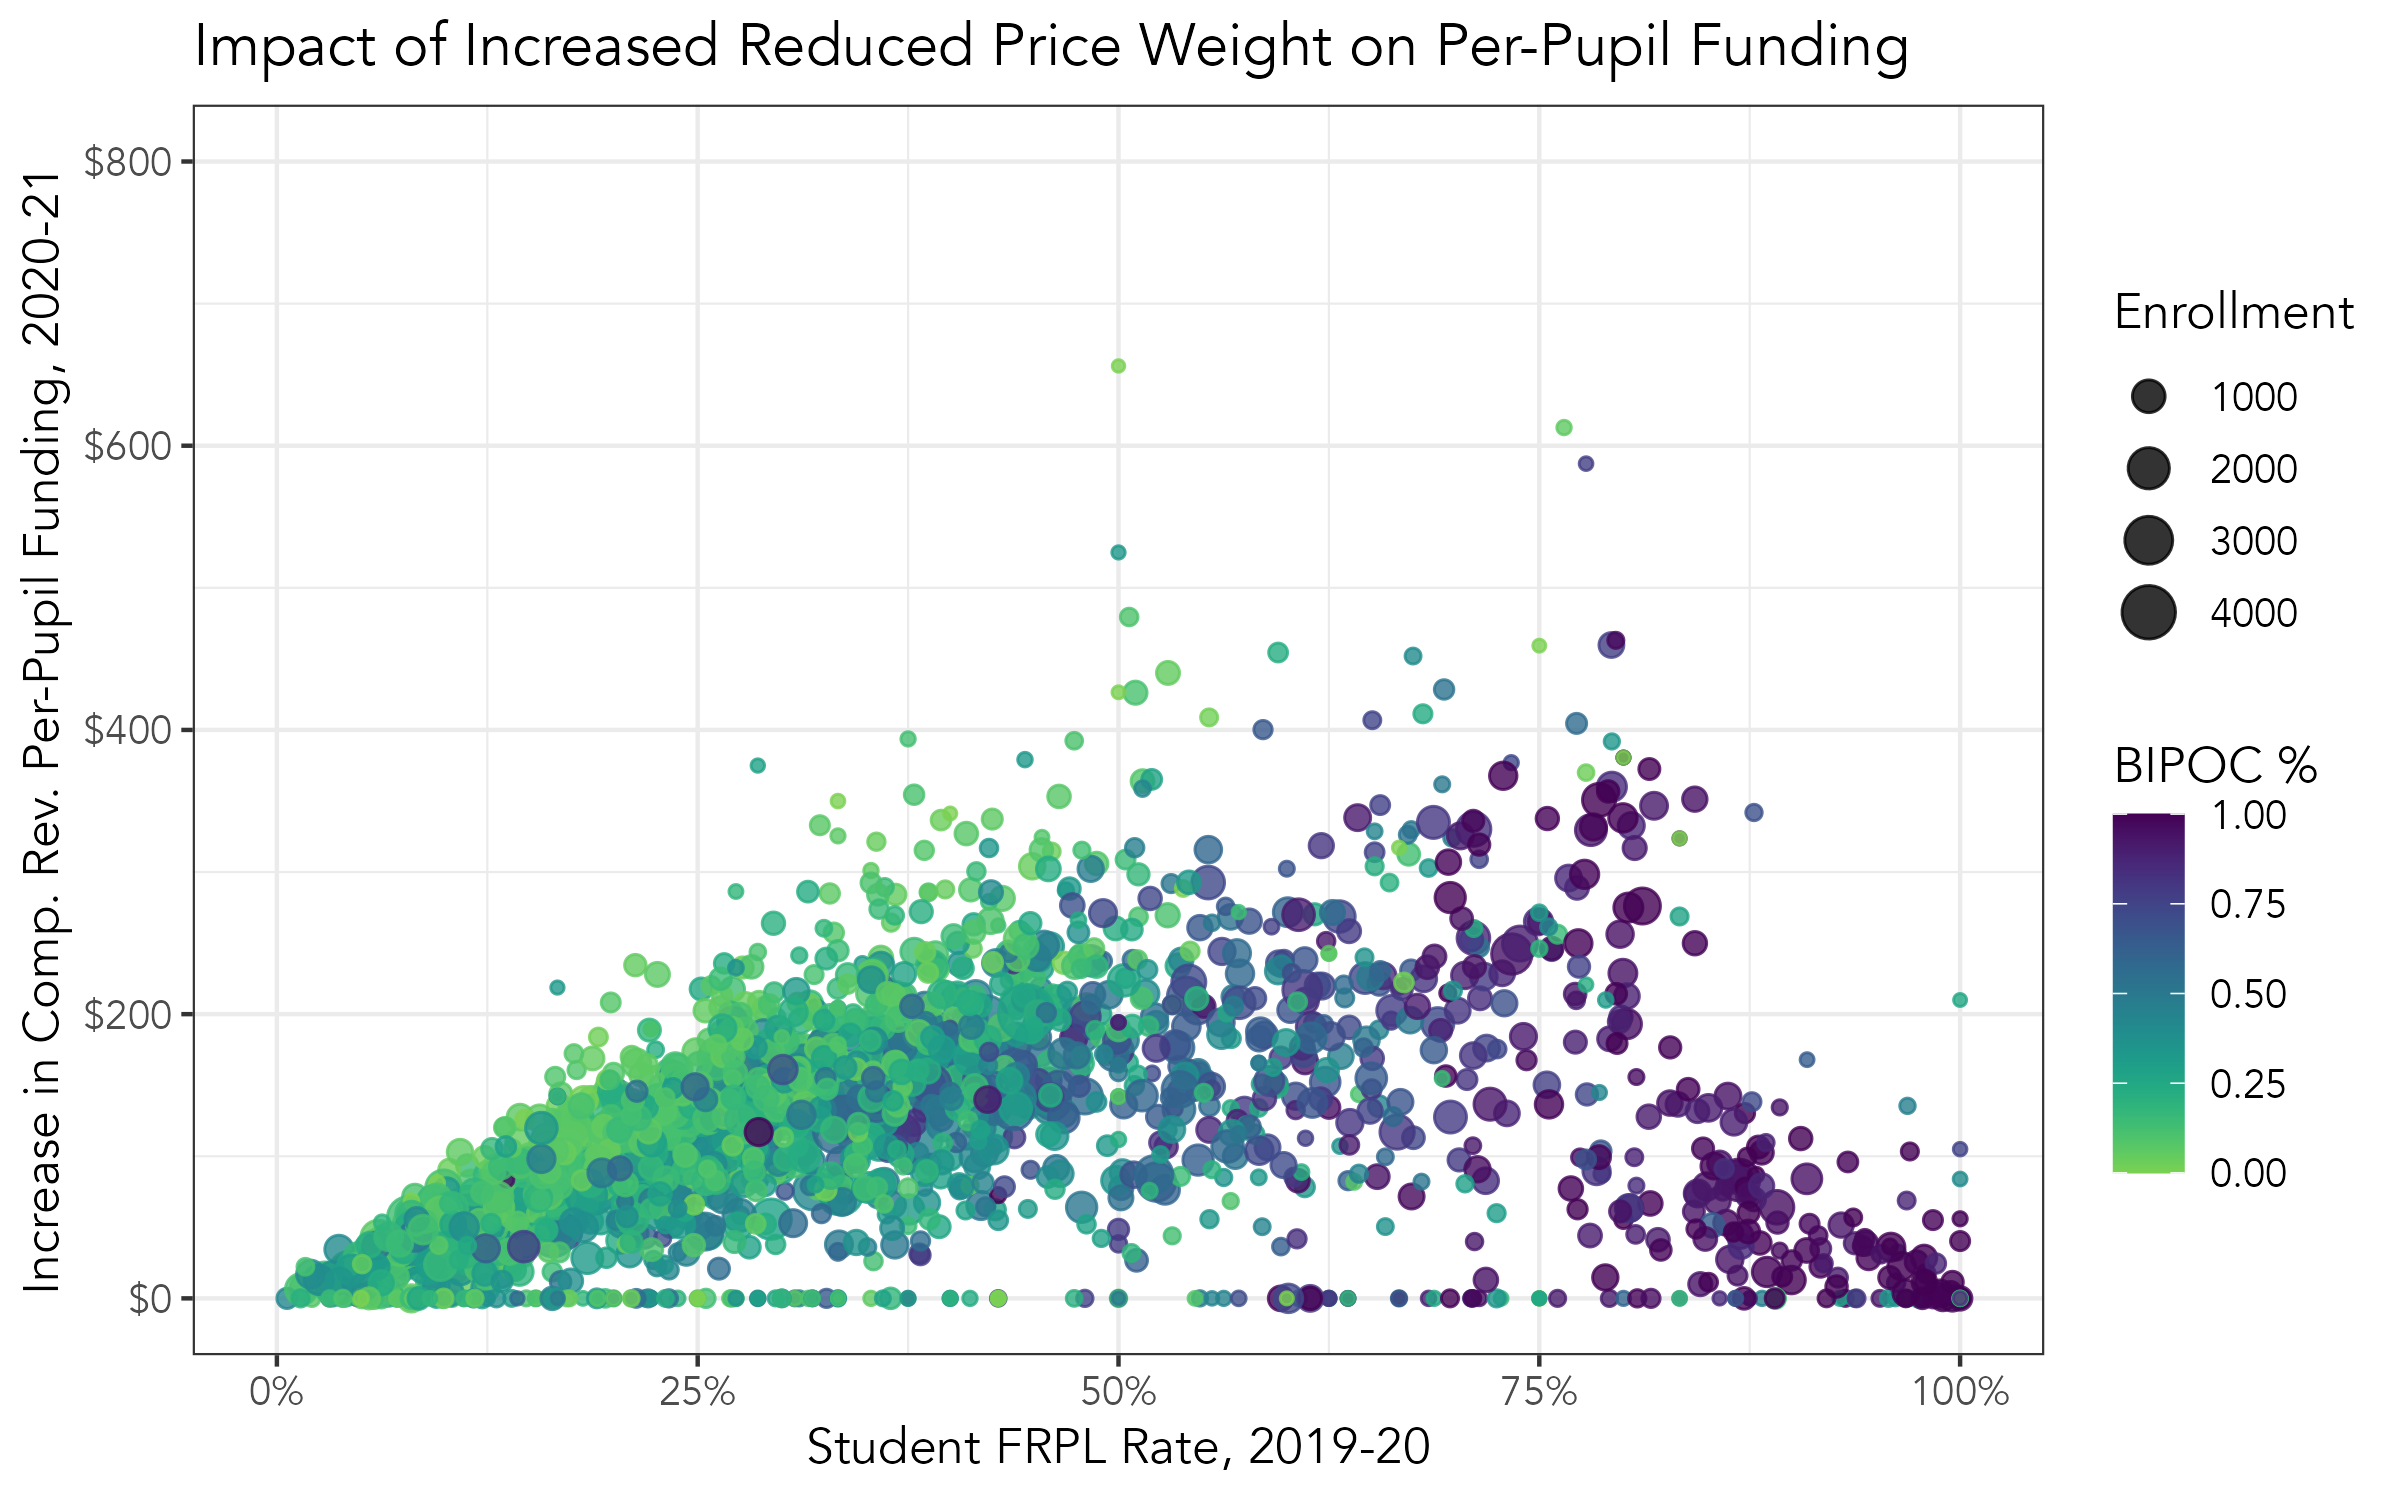
Impact on increasing the reduced price weight from 0.5 to .75
The scatterplot shows the increase in per-pupil funding when the weight for reduce price lunch students. Not every school would benefit from the change, because they either have 0 or very few students who qualify for reduced price lunch. Schools with more students who qualify for reduced price lunch would benefit more than schools that do not.

Homework
Write an overview of the policy problem you want to model in your capstone project and submit it to Alex and Krista by Monday, August 7. The overview should include descriptions of:
- An overview of the policy problem
- 2-3 policy changes you want to model
- How you will know if the policy options would be an improvement over current policy
- Data you will use to do your analysis
Schedule at least one office hours session with Alex and Krista the week of August 14. As a reminder, capstone projects will be presented on Tuesday, August 29 from 2:00 - 4:00 PM CST.
